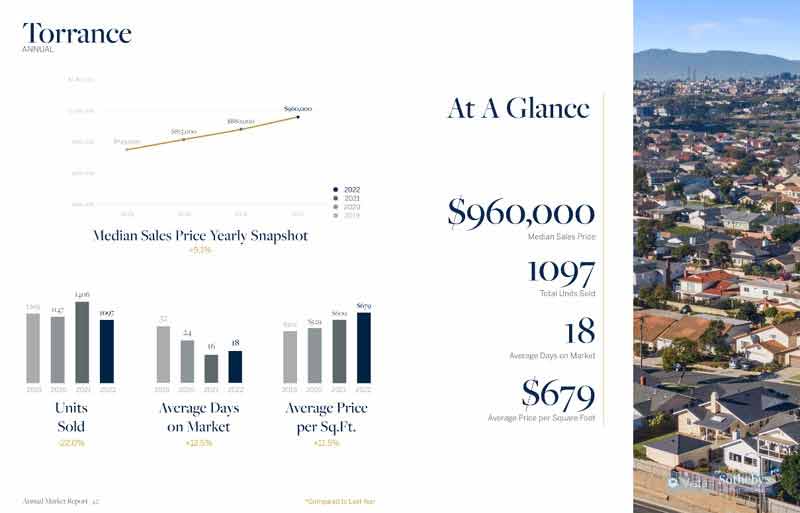
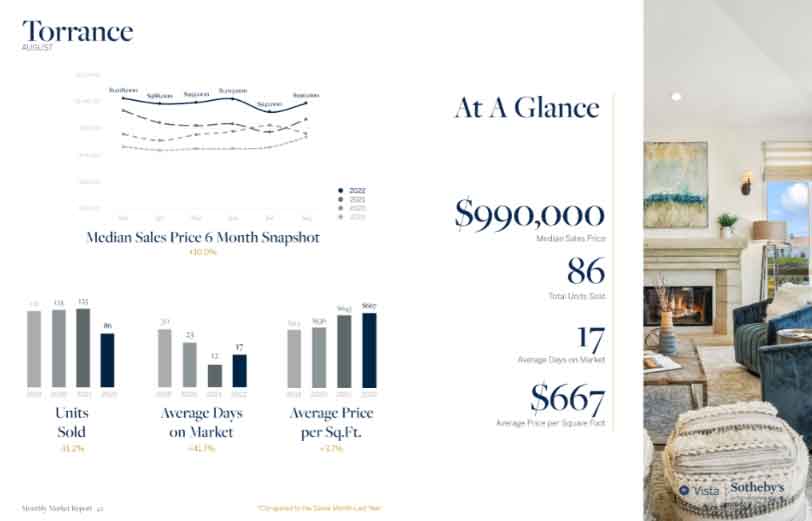
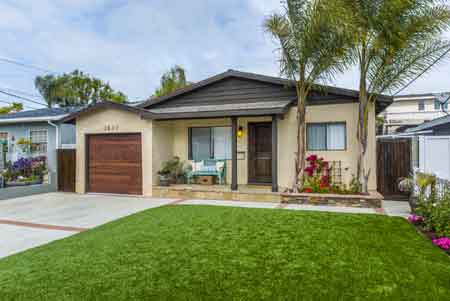
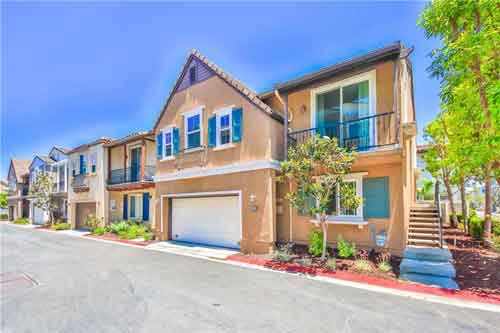
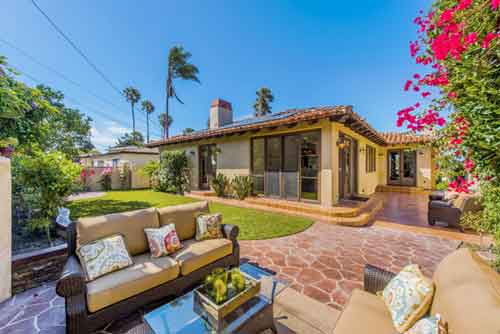
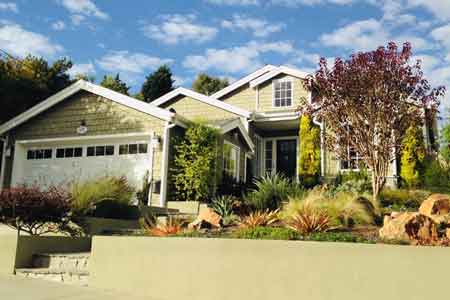
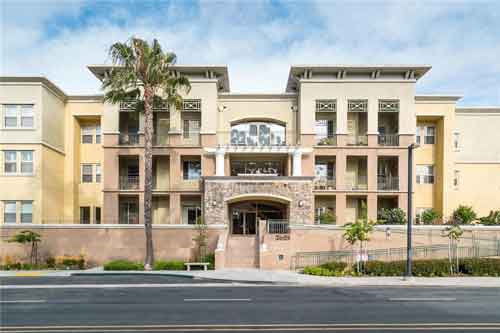
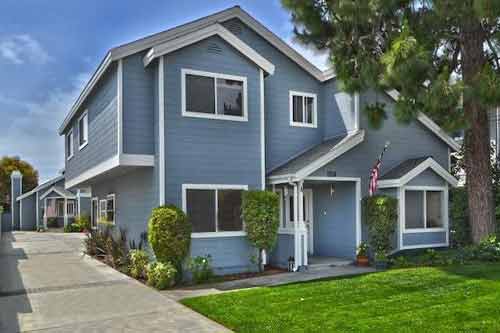
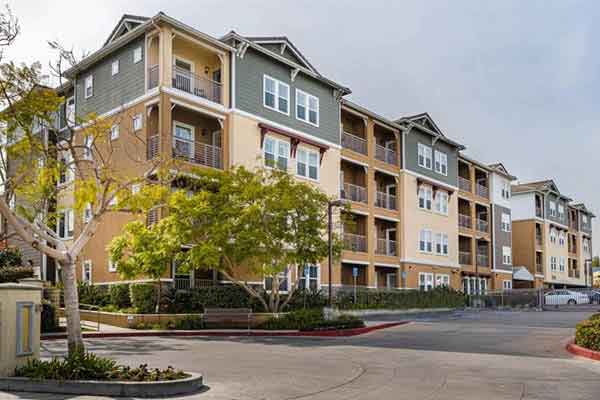
What a year it was for home sales and home prices in Torrance CA. There were 1,097 condos, townhomes and homes sold during 2022.
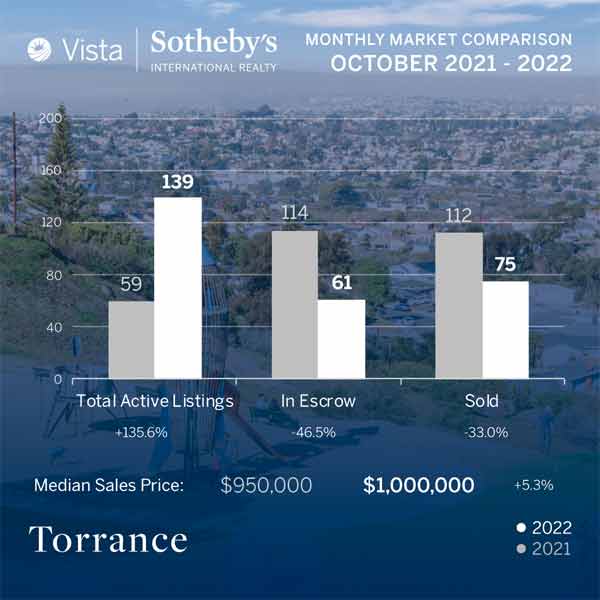
The median sales price was an impressive $960,000 and average price per square foot was $679.
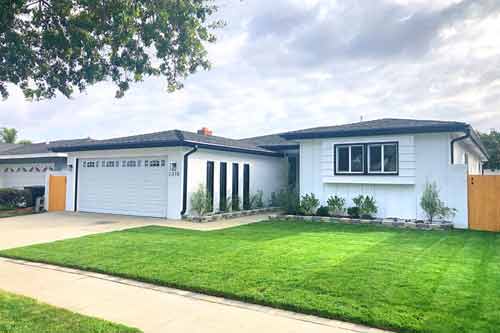
Homes averaged only 18 days on market before going into escrow. View the current Torrance homes for sale.
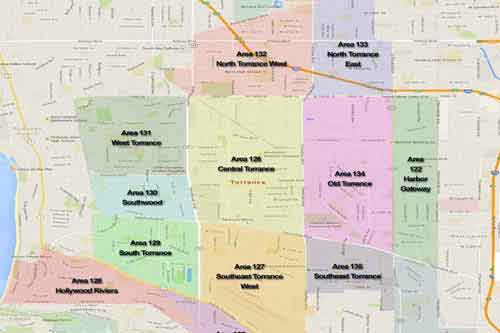
Torrance 2022 Real Estate Market at a Glance