• Home
  • FREE Email Listing Updates
  • Search for Homes
    • Search The MLS
    • Search All Torrance
    • Search By Map
    • West Torrance
    • Southwood
    • South Torrance
    • Hollywood Riviera
    • North Torrance
    • Old Torrance
    • Central Torrance
    • South East Torrance
    • Marble Estates
    • Walteria and Victoria Knolls
    • County Strip/ Harbor Gateway
    • Plaza Del Amo
    • Foreclosures
    • South Bay homes & real estate
  • Search by Price
    • Below $350,000
    • $350,000 – $450,000
    • $450,000 – $550,000
    • $550,000 – $650,000
    • $650,000 – $750,000
    • $750,000 – $850,000
    • $850,000 – $1,050,000
    • Above $1,050,000
  • Sellers
    • What is my Home Worth?
    • How We Sell
    • Quick Home Valuation
    • Recent Home Sales
    • Quick Valuation
  • Market News
  • About
    • Your Torrance Realtor
      • Client Testimonials
      • Vista Sotheby’s
      • Contact Us – Torrance Realtor Keith Kyle of Vista Sotheby’s
      • Search for Homes by Torrance Neighborhood
      • The Cities in the South Bay
      • Our Google+ Profile
      • Home Selling Process
    • Torrance Unified Schools – Great Schools Make for Great Neighborhoods
    • Recent Torrance Sales & Home Prices
    • Market Trends
      • Hollywood Riviera
      • West Torrance
      • Walteria
      • Old Torrance
      • North Torrance West
  • Neighborhoods
    • Torrance Schools
    • Neighborhood Map
    • West Torrance
    • Southwood
    • Hollywood Riviera
    • Walteria & Victoria Knolls
    • South Torrance
    • Old Torrance
    • North Torrance
    • Plaza Del Amo
    • Central Torrance
    • 55+ Senior Communities
    • Souoth Bay and Palos Verdes

Torrance real estate and homes for sale

Keith Kyle - Vista Sotheby's International

2022 Torrance Real Estate Market Recap – By the Numbers

January 22, 2023 by Keith Kyle

What a year it was for home sales and home prices in Torrance CA.    There were 1,097 condos, townhomes and homes sold during 2022.

The median sales price was an impressive $960,000 and average price per square foot was $679.

Homes averaged only 18 days on market before going into escrow.  View the current Torrance homes for sale.

Torrance 2022 Real Estate Market at a Glance

Filed Under: Torrance CA real estate market, Torrance home prices, Torrance homes for sale, Torrance Real Estate, Torrance real estate trends Tagged With: current homes for sale in torrance, torrance home prices, torrance home sales, torrance homes for sale, torrance real estate 2022, torrance real estate market

2022 Torrance Real Estate Recap – By the Numbers

January 16, 2023 by Keith Kyle

Let’s take a quick look at the Torrance real estate market in 2022 and how each month fared. Belmar homes

There were 1,103 homes, condos and townhomes  in Torrance sold during 2022 with an average “list” price of $997,659 and an average sold price of $1,029,793. The median listing price was $949,888 and the median sold price was $960,000. Homes averaged only 18 days on the market before going into escrow. The median days on market was an incredibly low 9 before going into escrow.

As is the norm the summer months were the busiest with the market much slower from December through April.

If you’re looking towards the future and not the past, search the current homes for sale in Torrance CA.

Date Jan Feb March April May June July August Sept Oct Nov Dec
For Sale 47 52 76 67 101 150 135 137 126 139 113 91
Sold 76 71 107 129 109 111 111 87 84 77 61 74
Avg. List Price $928K $1,018M $1,112M $1,153M $1,246M $1,119M $1,159M $1,139M $ 1,165M $1,083M $1,032M $1,018M
Avg. Sold Price $963K $ 968K $1.056M $1,048M $ 1,111M $1,063M $1,027M $1,047M $1,004M $1,043M $ 976K $ 967K
Avg. Sq. Ft. Price (Sold) 641 700 667 701 753 710 689 668 673 671 616 601
Avg Days on Market 20 14 10 12 11 9 15 17 24 27 28 43


Filed Under: Buyers, Homes for Sale, Torrance CA real estate market, Torrance home prices, Torrance homes for sale, Torrance Real Estate, Torrance real estate trends, Torrance Realtors Tagged With: real estate in torrance ca, torrance home sales, torrance real estate, torrance real estate market

Torrance Home Sales October 2022 Compared to 2021

November 19, 2022 by Keith Kyle

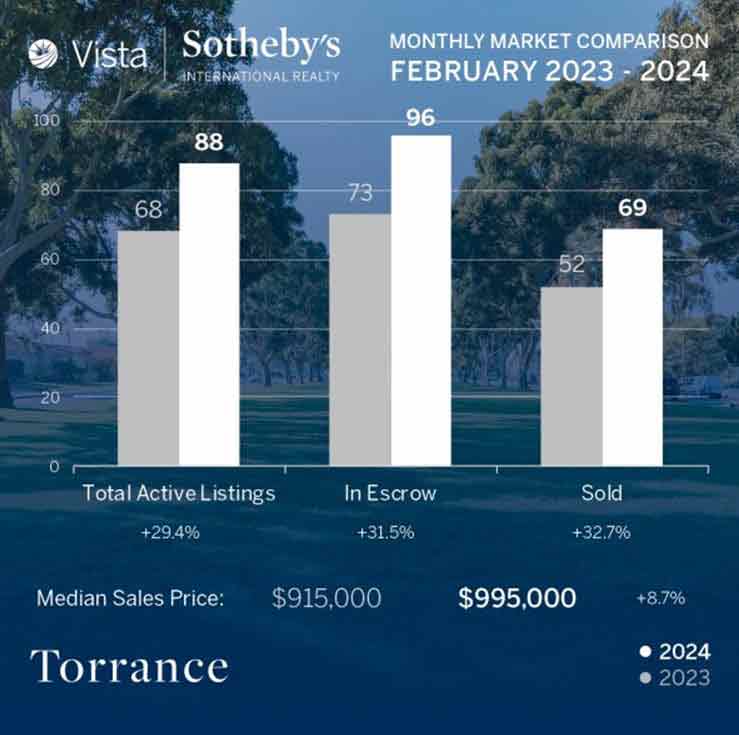
See below for a real estate recap of the real estate market in Torrance CA in October 2022 compared with October of the previous year.  Home sales plummeted from 112 in October 2021 to only 75 this past month.  Not surprisingly active listings (current homes for sale in Torrance) was only 59 last year and jumped to 139 active homes for sale in October 2022.  View all of the homes that sold in Torrance in October 2022 and see addresses, details, prices and more.

Filed Under: Realtor Keith Kyle, Torrance home prices, Torrance homes for sale, Torrance Real Estate, Torrance real estate trends, Torrance Realtors Tagged With: median sales prices, october real estate in torrance, torrance active listings, torrance homes for sale, torrance sold homes

76 October Home Sales in Torrance CA – Market Slowing Down

November 11, 2022 by Keith Kyle

Torrance Real Estate Update for October 2022

The real estate market in Torrance cooled a bit for  the number of homes that sold but home prices continued to impress.  There were 76  homes that closed escrow during the month which was down from the 86 sales in September.  Compared with the peak summer month of 112 homes that sold in July and you can see how slow the market was.

The average “list” price for the homes that sold during October was a very impressive $1,048,419 with the average sold price at $1,045,073 meaning that homes generally slightly below full price for the 2nd month in a row. Both numbers were higher than in September.

The average price per foot for the month was $695 which was slightly higher than in September. The average days on market was a short 25 before going into pending status compared with 19 in the prior month.  See how that compares with other months on our Torrance real estate trends and statistics page.

Search the current homes for sale in Torrance

October 2022 Torrance Home Sales and Prices

Type Address Price $ Per Sq Ft Bed/Bath Sq Feet Year
CONDO/A 1432 W 227th ST #3 $405,000 $527.34 2/1,0,0,0 768/A 1984/PUB
TWNHS/A 1514 W 207th ST #C $659,000 $403.55 3/2,0,1,0 1633/A 2005/ASR
SFR/D 1568 W 219th ST $734,800 $707.90 3/2,0,0,0 1038/A 1946/ASR
CONDO/A 21415 S Vermont AVE #29 $400,000 $722.02 1/1,0,0,0 554/A 1990/ASR
CONDO/A 23300 Marigold Ave #Z203 $445,000 $559.05 2/1,0,0,0 796/A 1973/ASR
CONDO 22331 Harbor Ridge LN #5 $570,000 $521.98 2/2,0,0,0 1092/ 1979
TWNHS/A 23323 Sesame ST $620,000 $504.89 3/2,0,0,0 1228/A 1974/ASR
SFR/D 1120 Torrance BLVD $726,000 $676.61 3/1,0,0,0 1073/A 1953/ASR
SFR/D 2602 Dalemead ST $1,000,065 $842.51 3/1,0,0,0 1187/A 1953/ASR
SFR 2425 Loftyview DR $1,105,000 $910.21 3/2,0,0,0 1214/A 1955/ASR
SFR/D 3425 Cricklewood ST $1,129,000 $637.49 4/2,0,0,0 1771/A 1951/PUB
SFR/D 2715 Grand Summit RD $1,320,000 $802.92 3/2,0,0,0 1644/A 1954/ASR
SFR/D 24450 Neece AVE $1,950,000 $519.45 5/5,0,0,0 3754/AP 2015/ASR
CONDO/A 2605 Sepulveda BLVD #201 $555,000 $558.91 1/1,0,1,0 993/A 2003/ASR
CONDO/A 2563 Plaza Del Amo ST 0 #103 $635,000 $603.61 1/2,0,0,0 1052/A 1985/ASR
COOP/A 3205 Merrill Drive #7 $650,000 $448.28 2/1,1,0,0 1450/E 1963/ASR
TWNHS/A 2800 Plaza Del Amo #139 $780,000 $658.23 2/2,0,1,0 1185/A 1989/ASR
TWNHS/A 3101 Plaza Del Amo #58 $795,000 $670.32 2/1,1,1,0 1186/A 1986/ASR
TWNHS/A 2800 Plaza Del Amo #24 $799,000 $627.65 2/2,0,1,0 1273/A 1989/ASR
TWNHS/A 2300 Maple ave AVE #50 $860,000 $502.04 3/2,0,1,0 1713/A 1989/ASR
SFR/D 21624 Madrona AVE $1,025,000 $619.71 4/2,0,0,0 1654/A 1955/ASR
CONDO/D 2611 Woodbury DR $1,075,000 $440.75 3/2,0,1,0 2439/A 1987/ASR
SFR/D 1203 Hickory AVE $1,135,000 $701.05 3/2,0,0,0 1619/A 1951/ASR
SFR/D 923 Hickory AVE $1,180,000 $774.28 3/2,0,0,0 1524/A 1951/ASR
TWNHS/D 2897 Maricopa ST $1,380,000 $444.87 4/3,1,0,0 3102/A 2007/ASR
CONDO/A 24410 Crenshaw Blvd. #121 $380,000 $532.96 1/1,0,0,0 713/A 1987/ASR
SFR/D 2874 W 229th St $1,370,000 $586.22 4/1,2,0,0 2337/A 1963/ASR
SFR/D 2619 West 232nd Street $2,498,888 $516.41 4/3,0,3,0 4839/A 1983/ASR
SFR/D 5044 Pacific Coast $1,320,000 $1,092.72 3/0,1,1,0 1208/A 1953/PUB
SFR/D 4532 Highgrove AVE $1,500,000 $829.65 3/2,1,0,0 1808/A 1978/ASR
SFR/D 5316 Highgrove ST $1,675,000 $850.25 3/1,0,1,0 1970/P 1954/PUB
SFR/D 4625 Paseo De Las Tortugas $1,785,000 $1,117.02 3/2,0,0,0 1598/A 1956/ASR
SFR/D 4416 W 231st $1,003,000 $952.52 3/1,0,0,0 1053/A 1954/ASR
TWNHS/A 22505 Kent AVE $1,029,000 $545.89 3/2,0,1,0 1885/A 1999/PUB
SFR/D 23327 Anza AVE $1,035,000 $682.72 3/2,0,0,0 1516/A 1960/ASR
SFR/D 23028 Evalyn AVE $1,050,000 $997.15 3/1,0,0,0 1053/A 1954/ASR
SFR/D 23014 Galva AVE $1,270,000 $610.58 4/0,3,0,0 2080/A 1967/ASR
SFR/D 5320 Linda DR $1,350,000 $1,261.68 3/1,0,0,0 1070/A 1951/ASR
SFR/D 23337 Ocean AVE $1,400,000 $535.99 5/2,0,0,0 2612/P 1965/ASR
CONDO 5500 Torrance BLVD #A307 $895,000 $647.14 3/2,0,0,0 1383/ 1990
SFR/D 4106 Torrance BLVD $1,000,000 $623.44 3/2,0,0,0 1604/A 1956/ASR
SFR/D 21425 Marjorie AVE $1,135,000 $854.03 3/2,0,0,0 1329/A 1956/ASR
SFR/D 22102 Elmo Avenue $1,170,000 $995.74 3/2,0,0,0 1175/A 1955/ASR
SFR/D 5021 Lillian ST $1,327,000 $788.47 3/2,0,0,0 1683/A 1956/PUB
SFR/D 21606 Vicky AVE $1,450,000 $834.29 4/3,0,0,0 1738/E 1955/ASR
SFR/D 22114 Redbeam AVE $2,604,000 $881.52 5/4,0,1,0 2954/A 2003/PUB
TWNHS 4506 Spencer ST $991,000 $392.48 3/2,0,1,0 2525/A 1984/ASR
SFR/D 4551 Narrot ST $995,000 $888.39 3/1,0,0,0 1120/A 1954/ASR
SFR/D 20016 Entradero AVE $1,350,000 $785.34 3/2,0,0,0 1719/T 1955/ASR
SFR/D 19321 Sturgess DR $1,363,000 $857.23 3/1,1,0,0 1590/A 1956/PUB
SFR/D 20355 Tomlee AVE $1,400,000 $859.42 3/2,0,0,0 1629/A 1959/ASR
SFR/D 5227 Emerald ST $1,660,000 $735.82 4/2,0,1,0 2256/A 1972/ASR
CONDO/A 16700 Yukon AVE #210 $550,000 $640.28 2/2,0,0,0 859/A 1989/ASR
CONDO/A 16700 Yukon Av. #211 $590,000 $686.85 2/2,0,0,0 859/P 1989/ASR
SFR/D 4007 W 175th PL $817,000 $734.71 3/1,0,0,0 1112/A 1953/ASR
SFR/D 3905 W 176th ST $839,000 $575.45 3/1,0,1,0 1458/A 1953/ASR
SFR/D 4303 W 178th ST $954,000 $728.80 2/2,0,0,0 1309/T 1949/PUB
SFR/D 18339 Faysmith AVE $959,000 $606.96 4/1,1,0,0 1580/A 1956/ASR
SFR/D 18519 Bailey DR $995,775 $969.60 3/1,0,0,0 1027/A 1955/ASR
SFR/D 18413 Patronella AVE $1,050,000 $791.26 3/1,0,1,0 1327/A 1954/ASR
SFR/D 3415 W 187th ST $1,095,000 $863.56 3/2,0,0,0 1268/A 1950/ASR
SFR/D 18232 Saint Andrews PL $880,000 $625.44 4/2,0,0,0 1407/A 1953/ASR
SFR/D 2513 W 178th ST $885,000 $759.01 3/1,0,1,0 1166/A 1955/ASR
SFR/D 2626 W 166th PL $945,000 $706.81 3/1,1,0,0 1337/A 1955/ASR
SFR/D 18318 Wilton Pl $1,050,000 $656.25 3/1,1,0,0 1600/A 1962/ASR
SFR 16908 Atkinson AVE $1,207,000 $561.13 4/3,0,0,0 2151/A 1959/ASR
CONDO/A 1301 Cabrillo AVE #307 $605,000 $674.47 2/2,0,0,0 897/A 1993/ASR
TWNHS/A 2031 Cabrillo AVE $740,000 $649.69 3/2,0,1,0 1139/A 1984/ASR
SFR/D 1614 Crenshaw BLVD $750,000 $901.44 2/1,0,0,0 832/A 1929/ASR
TWNHS/A 1021 Cravens AVE #20 $795,000 $543.78 2/2,0,1,0 1462/AP 2006/ASR
TWNHS/A 2150 Washington AVE $817,000 $592.46 2/2,0,1,0 1379/A 2006/PUB
TWNHS 807 Van Ness AVE #D $895,000 $608.84 3/2,0,1,0 1470/ 2000
SFR/D 2265 W 236th PL $700,000 $385.04 3/1,0,0,0 1818/A 1955/ASR
SFR/D 23640 Cabrillo AVE $973,000 $593.29 3/2,0,0,0 1640/A 1953/ASR
SFR/D 1943 Reynosa DR $1,120,000 $666.27 4/3,0,0,0 1681/SEE 1948/ASR
SFR/D 2232 W 238th ST $1,275,000 $684.75 3/2,0,1,0 1862/A 1953/ASR

Filed Under: Home Prices, Homes for Sale, Torrance homes for sale, Torrance Real Estate, Torrance real estate trends, Torrance Realtors Tagged With: home prices in torrance, home sales in torrance, october home sales in torrance, torrance home prices, torrance real estate

See the Homes that Sold in Plaza Del Amo in September

October 22, 2022 by Keith Kyle

September 2022 Plaza Del Amo Home Sales and Prices

September was a slow month for the number of closed home sales in the gated communities of Plaza Del Amo and central Torrance neighborhoods, with only 5 homes sold.

The average “list” price for the homes that sold was a very impressive $914,580 with the average sold price at $918,400 meaning that homes sold close, but slightly higher than full price.  This was one of the few cities or neighborhoods in the South Bay that showed homes still selling higher than the list price.

The average days on market for the homes that sold was a very brief 17 and average price per foot for the month was $614.

Of the homes that sold one was in Windemere, one in Summerwind and one in Belmar.  The home in Belmar located at 2785 Maricopa Street sold for an impressive $1,275,000.

See how that compares with other months on our Torrance real estate trends and statistics page.

Search the current homes for sale in Torrance

Plaza Del Amo and Central Torrance Home Sales September 2022

Ptop Type Address Price $ Per foot Bed/Bath Sq Feet Year
CONDO 2571 Plaza Del Amo #203 $590,000 $678 1/2,0,0,0 870/A 1985/ASR
COOP 3210 Merrill DR #39 $595,000 $441 3/2,0,0,0 1350/E 1963/ASR
TWNHS 2800 Plaza Del Amo #483 $747,000 $687 2/2,0,1,0 1088/A 1987/ASR
SFR 2785 Maricopa ST $1,275,000 $508 4/2,0,1,0 2512/P 2005/PUB
SFR 3309 Antonio ST $1,385,000 $762 3/2,1,0,0 1818/A 1955/ASR

Filed Under: Plaza Del Amo, Torrance gated communities, Torrance home prices, Torrance homes for sale, Torrance Real Estate, Torrance real estate trends, Torrance Realtors, Vista Sotheby's International Realty Tagged With: central torrance home prices, central torrance home sales, gated communities of plaza del amo, plaza del amo hme prices, plaza del amo home sales, plaza del amo torrance

August 2022 Home Prices in Torrance

September 10, 2022 by Keith Kyle

Real Estate Recap – Home Sales and Home Prices for August 2022

August 2022 home sales in Torrance  was a slower month for both the number of homes that sold and the prices that they sold for.  There were 88 homes that closed escrow during the month.  That was a really down from the 112 homes that sold in July.

The average “list” price for the homes that sold during August was a very impressive $1,049,773 with the average sold price at $1,045,279 meaning that homes generally slightly below full price for the first time in quite a while.

The average price per foot for the month was $681 which was down from July. The average days on market was a very short 19 before going into pending status.  See how that compares with other months on our Torrance real estate trends and statistics page.

Search the current homes for sale in Torrance

August 2022 Torrance Home Sales and Prices

Type Address Price $ Per Foot Bed/Bath Sq Feet Year
CONDO/A 1115 Sepulveda $475,000 $597 2/1,0,0,0 796/P 1973/PUB
TWNHS/A 1614 207 ST #1 $700,000 $355 3/2,0,1,0 1970/B 2006/ASR
CONDO/A 23314 Sesame Street #K $357,000 $559 1/1,0,0,0 639/A 1973/ASR
CONDO/A 21415 S Vermont AVE #22 $402,000 $684 1/1,0,0,0 588/A 1990/ASR
CONDO/A 20543 S Vermont AVE #2 $430,000 $651 1/1,0,0,0 661/A 1982/ASR
CONDO/A 21828 S Vermont AVE #3 $512,000 $553 2/2,0,0,0 926/A 1994/ASR
TWNHS/A 829 Coriander DR $565,000 $648 2/1,0,0,0 872/A 1974/ASR
SFR/D 22925 Berendo AVE $625,000 $534 2/1,0,0,0 1171/A 1951/ASR
SFR/D 714 W 209th ST $697,000 $653 3/1,1,0,0 1068/A 1957/ASR
TWNHS/D 1082 Park Circle DR $755,000 $424 4/2,0,1,0 1780/A 1984/ASR
SFR/D 22623 S Van Deene AVE $839,900 $624 3/2,0,0,0 1346/A 1959/ASR
SFR/D 900 Gastine ST $850,000 $577 3/2,0,0,0 1473/A 1953/ASR
SFR/D 929 Sorock DR $875,000 $714 3/2,0,0,0 1225/A 1956/ASR
SFR/D 21267 Doble Ave $935,000 $758 3/2,0,0,0 1233/A 1960/ASR
SFR/D 2811 Danaha ST $850,000 $582 4/2,0,0,0 1461/A 1952/ASR
SFR/D 2710 Portobello DR $1,020,000 $855 3/2,0,0,0 1193/A 1954/ASR
SFR/D 3229 Newton ST $1,116,000 $1,046 3/1,0,0,0 1067/A 1950/PUB
SFR/D 24716 Winlock DR $1,150,000 $805 3/1,1,0,0 1428/AP 1949/PUB
SFR/D 2705 Loftyview DR $1,265,000 $509 4/3,0,0,0 2485/A 1955/ASR
SFR/D 3201 Singingwood DR $1,332,000 $792 3/2,0,0,0 1682/A 1976/ASR
SFR/D 2826 Winlock RD $1,342,003 $891 4/1,1,0,0 1506/A 1952/ASR
SFR/D 3015 Windmill RD $1,450,000 $715 3/3,0,0,0 2028/A 1975/ASR
CONDO/A 3030 Merrill DR #3 $590,000 $472 2/2,0,0,0 1250/A 1963/ASR
TWNHS/A 2800 Plaza Del Amo #92 $770,000 $708 2/3,0,0,0 1088/A 1987/ASR
TWNHS/A 2971 Plaza Del Amo #292 $831,000 $611 2/3,0,0,0 1361/A 1985/ASR
TWNHS/A 2577 Plaza Del Amo #704 $872,000 $514 2/1,1,1,0 1696/A 1987/ASR
TWNHS/A 2300 Maple AVE #140 $928,500 $534 3/2,0,1,0 1738/A 1987/ASR
TWNHS/A 2801 Sepulveda Blvd Unit 109 $1,000,000 $552 3/2,0,1,0 1811/A 1995/ASR
SFR/D 917 Felbar AVE $1,050,000 $584 2/2,0,0,0 1799/A 1951/ASR
SFR/D 3110 Torrance Blvd $1,075,000 $621 4/2,0,0,0 1732/A 1952/ASR
TWNHS/A 2801 Sepulveda BLVD #124 $1,150,000 $572 3/2,1,0,0 2009/A 1996/ASR
TWNHS/A 3538 Torrance BLVD #141 $1,168,000 $559 3/3,0,0,0 2088/A 2005/ASR
SFR/D 20808 Avis AVE $1,320,000 $872 3/2,0,0,0 1514/A 1957/PUB
SFR/D 1115 Teri Avenue $1,400,000 $772 3/1,1,0,0 1814/E 1951/ASR
CONDO/A 22955 Maple Ave #B $500,000 $448 2/1,1,0,0 1117/A 1963/ASR
CONDO/A 22723 Maple AVE $710,000 $734 1/2,0,0,0 967/A 1963/ASR
SFR/D 22631 Hickory AVE $1,200,000 $809 3/2,0,0,0 1483/A 1960/ASR
SFR/D 23109 Cerise Avenue $1,600,000 $619 5/1,2,0,0 2586/P 1965/PUB
SFR/D 22635 Benner AVE $1,760,000 $737 5/3,0,0,0 2388/A 1963/ASR
SFR/D 3900 Paseo De Las Tortugas $1,450,000 $564 3/3,0,0,0 2572/A 1973/ASR
SFR/D 4132 Mesa ST $1,550,000 $625 3/2,0,1,0 2479/A 1975/ASR
SFR/D 5321 Highgrove ST $1,851,210 $1,064 3/2,0,0,0 1740/A 1954/ASR
SFR/D 154 Via Los Altos $1,950,000 $1,071 3/2,0,0,0 1820/E 1955/PUB
SFR/D 23125 Adolph AVE $1,780,000 $774 5/1,2,0,0 2301/A 1964/ASR
SFR/D 4633 Milne DR $1,900,000 $877 4/2,0,0,0 2166/A 1951/SEE
CONDO/A 21345 Hawthorne Blvd #108 $639,000 $702 2/1,1,0,0 910/A 2005/APP
CONDO/A 21345 Hawthorne BLVD #412 $675,000 $742 2/2,0,0,0 910/A 2005/ASR
SFR/D 4502 Torrance BLVD $825,000 $702 3/1,1,0,0 1175/A 1956/ASR
SFR/D 21429 Grant AVE $1,160,000 $997 3/1,0,1,0 1164/A 1956/ASR
SFR/D 4110 W Carson ST $1,250,000 $491 6/3,0,0,0 2545/A 1956/ASR
SFR/D 5520 Cathann ST $1,560,000 $921 3/1,1,0,0 1693/A 1955/ASR
SFR/D 5101 Merrill ST $1,700,000 $861 4/2,1,0,0 1974/O 1955/ASR
TWNHS/A 20310 Anza AVE #F $775,000 $681 2/2,0,1,0 1138/A 1981/ASR
SFR/D 5130 Carmelynn ST $1,200,000 $576 3/2,0,0,0 2082/P 1955/PUB
SFR/D 5522 Arvada ST $1,270,000 $812 3/1,1,0,0 1564/A 1956/ASR
SFR/D 4914 Halison ST $1,385,000 $870 3/2,0,0,0 1592/A 1955/ASR
SFR/D 20521 Wood AVE $1,475,000 $904 3/1,1,0,0 1632/A 1957/ASR
SFR/D 4803 Spencer ST $1,572,000 $698 4/3,0,0,0 2251/A 1971/ASR
SFR/D 4903 White Court $2,275,000 $663 5/4,0,1,0 3433/B 2020/BLD
SFR 18516 Falda AVE $720,000 $716 2/1,0,0,0 1006/A 1950/ASR
SFR/D 4302 W 176th ST $810,000 $451 3/1,0,1,0 1795/A 1952/PUB
SFR/D 16613 Patronella AVE $810,000 $514 4/2,1,0,0 1576/A 1952/ASR
SFR/D 3201 W 177th ST $829,000 $621 3/2,0,0,0 1334/A 1955/ASR
SFR/D 17017 Delia AVE $840,000 $1,002 2/1,0,0,0 838/A 1948/ASR
SFR/D 16931 Osage AVE $980,000 $926 3/1,0,0,1 1058/A 1951/PUB
SFR/D 3806 W 172nd ST $990,000 $645 3/1,1,0,0 1535/A 1955/ASR
SFR/D 3406 W 172nd ST $1,000,000 $612 3/2,0,0,0 1635/A 1953/ASR
SFR/D 16601 Delia AVE $1,070,000 $473 4/2,0,0,0 2260/A 1974/ASR
SFR/D 18924 Cerise Avenue $1,110,000 $648 5/1,2,0,0 1713/S 1953/ASR
SFR/D 4119 W 175TH PL $1,200,000 $764 4/1,1,1,0 1570/E 1953/ASR
SFR/D 3754 W 181st ST $1,250,000 $804 3/1,1,0,0 1554/A 1953/ASR
TWNHS/A 2451 Artesia BLVD #45 $718,000 $580 2/2,0,1,0 1237/A 1981/PUB
SFR/D 16802 Casimir AVE $820,000 $483 3/1,1,0,0 1696/A 1953/PUB
SFR/D 16508 Casimir AVE $875,000 $492 4/2,0,0,0 1780/A 1955/ASR
SFR/D 2059 W 162nd ST $930,000 $581 3/2,0,0,0 1602/A 1951/ASR
SFR/D 16918 Purche AVE $940,000 $806 3/2,0,0,0 1166/A 1956/ASR
SFR/D 2101 Johnson CT $950,000 $503 4/2,0,0,0 1890/A 1966/PUB
SFR/D 2305 W 171st ST $978,000 $839 3/1,1,0,0 1166/A 1956/ASR
TWNHS/A 2710 Cabrillo AVE $860,000 $521 3/3,0,0,0 1650/A 2006/ASR
TWNHS/A 2690 Cabrillo AVE $865,000 $531 3/2,0,0,1 1630/E 2006/EST
SFR/D 1407 Amapola AVE $870,000 $1,185 2/1,0,0,0 734/A 1930/ASR
SFR/D 2240 W 237th ST $990,000 $619 3/1,0,1,0 1600/E 1953/EST
SFR/D 23108 Walnut ST $1,015,000 $910 3/2,0,0,0 1116/A 1961/ASR
SFR/D 1833 W 243rd PL $1,080,000 $409 4/3,0,0,0 2642/A 1964/ASR
SFR/A 2278 W 230th ST $1,275,000 $624 4/2,0,0,0 2042/E 1958/ASR
SFR/D 2332 W 239th ST $1,299,900 $650 4/2,0,0,0 2000/A 1957/EST
CONDO/A 22635 Maple AVE #B $500,000 $448 2/2,0,0,0 1117/A 1963/PUB

Filed Under: Homes for Sale, Torrance home prices, Torrance homes for sale, Torrance Real Estate, Torrance real estate trends Tagged With: august home sales in torrance, torrance home prices, torrance home prices in august, torrance home sales, torrance real estate market

  • 1
  • 2
  • 3
  • …
  • 18
  • Next Page »
  • FREE Listing Updates
  • What’s Your Home Worth?
  • Search Torrance CA Homes For Sale