• Home
  • FREE Email Listing Updates
  • Search for Homes
    • Search The MLS
    • Search All Torrance
    • Search By Map
    • West Torrance
    • Southwood
    • South Torrance
    • Hollywood Riviera
    • North Torrance
    • Old Torrance
    • Central Torrance
    • South East Torrance
    • Marble Estates
    • Walteria and Victoria Knolls
    • County Strip/ Harbor Gateway
    • Plaza Del Amo
    • Foreclosures
    • South Bay homes & real estate
  • Search by Price
    • Below $350,000
    • $350,000 – $450,000
    • $450,000 – $550,000
    • $550,000 – $650,000
    • $650,000 – $750,000
    • $750,000 – $850,000
    • $850,000 – $1,050,000
    • Above $1,050,000
  • Sellers
    • What is my Home Worth?
    • How We Sell
    • Quick Home Valuation
    • Recent Home Sales
    • Quick Valuation
  • Market News
  • About
    • Your Torrance Realtor
      • Client Testimonials
      • Vista Sotheby’s
      • Contact Us – Torrance Realtor Keith Kyle of Vista Sotheby’s
      • Search for Homes by Torrance Neighborhood
      • The Cities in the South Bay
      • Our Google+ Profile
      • Home Selling Process
    • Torrance Unified Schools – Great Schools Make for Great Neighborhoods
    • Recent Torrance Sales & Home Prices
    • Market Trends
      • Hollywood Riviera
      • West Torrance
      • Walteria
      • Old Torrance
      • North Torrance West
  • Neighborhoods
    • Torrance Schools
    • Neighborhood Map
    • West Torrance
    • Southwood
    • Hollywood Riviera
    • Walteria & Victoria Knolls
    • South Torrance
    • Old Torrance
    • North Torrance
    • Plaza Del Amo
    • Central Torrance
    • 55+ Senior Communities
    • Souoth Bay and Palos Verdes

Torrance real estate and homes for sale

Keith Kyle - Vista Sotheby's International

You are here: Home / Torrance Real Estate Market Trends and Statistics – Where is the Market Heading?

Torrance Real Estate Market Trends and Statistics – Where is the Market Heading?

When buying or selling homes in Torrance, knowing and understanding the real estate market is critical to making the right decision.  Real 
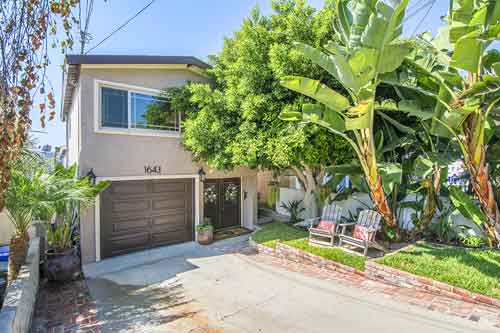
estate trends can help determine current values or even when the appropriate time to list and sell your Torrance home. The information below is intended to help you get a better understanding of what is happening in the market.

View the current homes for sale in Torrance

Torrance Real Estate Market Statistics

The chart below shows the average price per square foot. Square footage in the South Bay often doesn’t mean as much as in other markets as values can vary so dramatically due to things such as proximity to the beach, views, specific neighborhoods.

The chart below shows the average price per foot for sold homes.

The chart below shows the average days on market per month as well as the % of list price that homes sold at.  A high % indicates a sellers market as home sell at, or above list price.

The chart below shows the average price for listed home sales in relation to the average price for sold homes.

The chart below indicates the months of home inventory based on closed home sales.  Buyer’s market: more than 6 months of inventory  Seller’s market: less than 3 months of inventory  Neutral market: 3 – 6 months of  inventory

  • FREE Listing Updates
  • What’s Your Home Worth?
  • Search Torrance CA Homes For Sale