By Keith Kyle
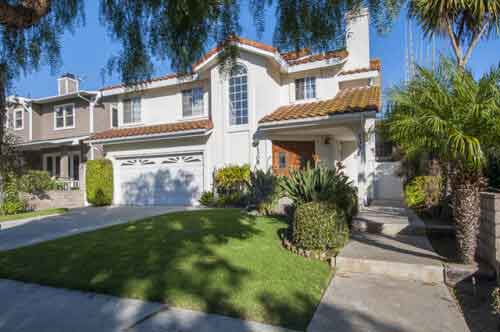
I received an odd phone call yesterday from a potential buyer that said she had been given a real estate flyer for a listing at 16808 Delia in North Torrance. She said it was a well priced short sale and it was. The only problem was that I sold this house at the beginning of 2012. It had been a while since I thought of this house and upon pulling up the old listing I struck me just how dramatically the market has changed since then. It was a very nice home, with a great yard and pool but unfortunately the owners were struggling and had to do a short sale. We listed the home at $520,000 and it closed at $502,000.
What would it sell for now?
It would be just about impossible to find any single family home in that neighborhood, regardless of condition and size for that price in the current market. That home that sold only 2 years ago would now sell for at least $750,000 which is simply incredible. The speed with which the real estate market in Torrance and the South Bay was stunning and the changes to value equally unbelievable.
How Quickly we forget?
Another aspect of all this that struck me was just how short our memories can be. Just 2 years ago there were so many homes with great prices and most buyers thought it would continue and go even lower. These days the poor buyers that didn’t buy are priced completely out of neighborhoods that would have been very affordable. The thought now is that it of course can only continue going up, but is that really the reality and has that much changed? It’s certainly a great time to be a home seller, but not necessarily a great time to be a buyer.
[idx-listings community=”North Torrance West” statuses=”1″ propertytypes=”516″ orderby=”DateAdded” orderdir=”DESC” count=”10″]


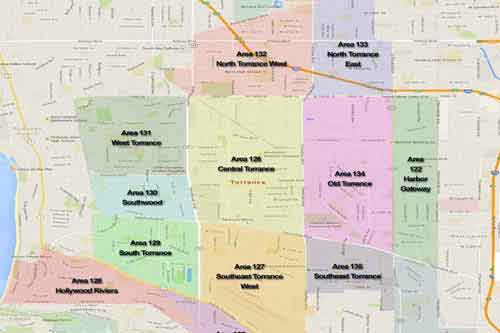
 past 3 months have seen a slight increase in inventory which may be temporary or may be showing signs that the very beginning of a more balanced market is on it’s way. Keep in mind that Torrance is a big city and prices, demand, values, and trends can vary considerably throughout the city. The chart below shows the number of
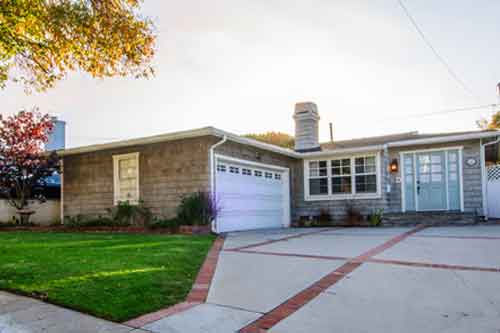
  Redondo Beach and the proximity to the ocean means milder weather and great ocean breezes that other parts of the city don’t enjoy. Comprised mainly of 1940s and 1950s beach style bungalows, the area is still more affordable than some of the nearby beach cities while still having a certain charm lost in some of these other areas with oversized homes, makes a statement type architecture and over development. Some homes have gone the route of maximum square footage, but the majority still look like homes that belong in the neighborhoods and give homeowners a bit of space and separation. Although prices are still below neighboring South Redondo, they have risen dramatically in the past 2 years with most original smaller 3 bed/1 bath homes starting in the mid to low $600’s for fairly original, but nice condition, and the larger 3 bed/2 bath 1400 foot (many homes added a family room accounting for the extra square footage) selling anywhere from the mid to low $700s up to the low $900’s depending on location and condition.