By Keith Kyle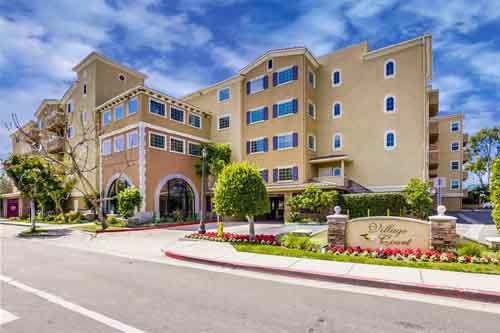
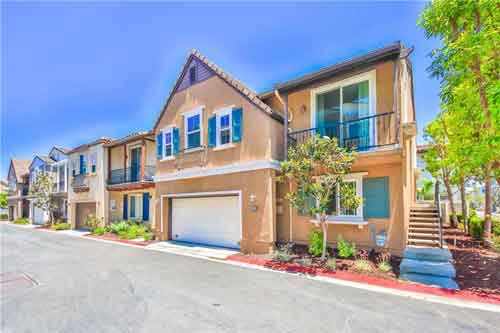
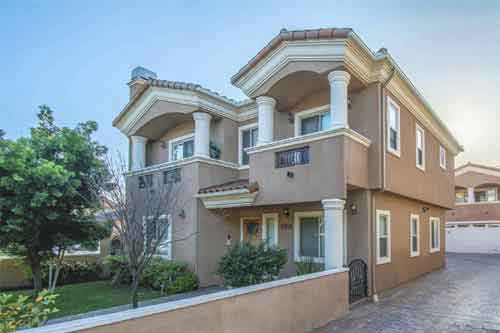
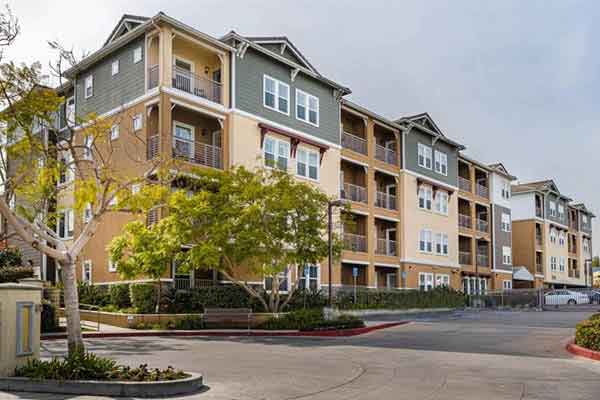
Village Court, located at 21345 Hawthorne Blvd in the great area of Southwood Torrance may just be the nicest 55+ complex in the South Bay. Located in a great part of Torrance, with an abundance of shopping and dining options just a short distance away, Village Court offers resort style living.
View the Current Village Court Homes for Sale
Amenities include a fitness center, clubhouse with billiards and social areas, a fantastic pool and entertainment deck with a sparkling pool and spa, outdoor dining areas, fireplaces, and BBQ areas. Having been built in 2005, the complex and condos still feel very new and have the latest features such as open kitchens, granite counters, and more.


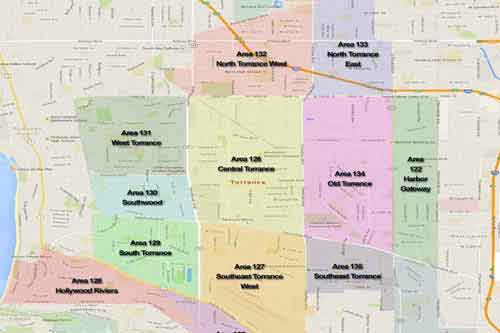
 past 3 months have seen a slight increase in inventory which may be temporary or may be showing signs that the very beginning of a more balanced market is on it’s way. Keep in mind that Torrance is a big city and prices, demand, values, and trends can vary considerably throughout the city. The chart below shows the number of
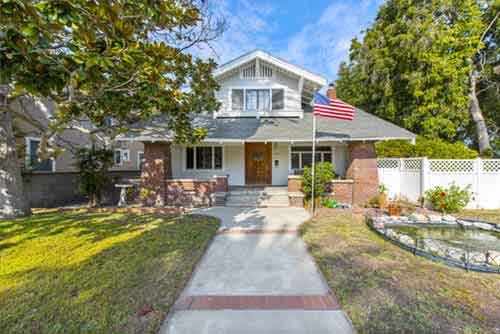
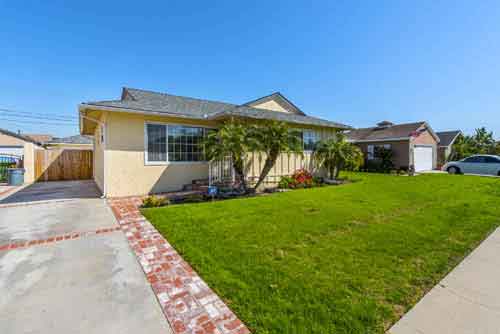
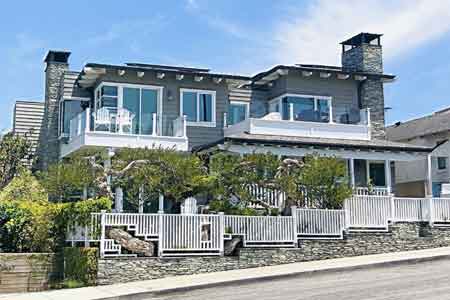
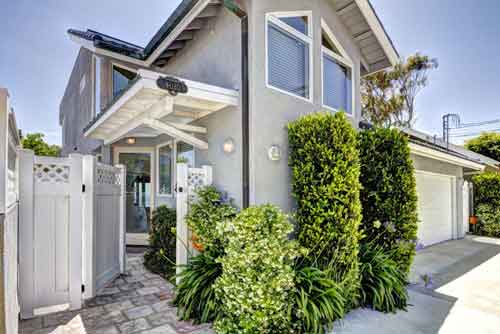
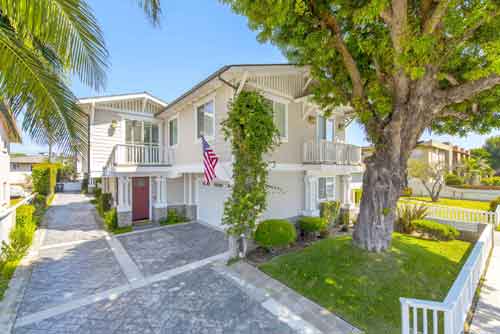
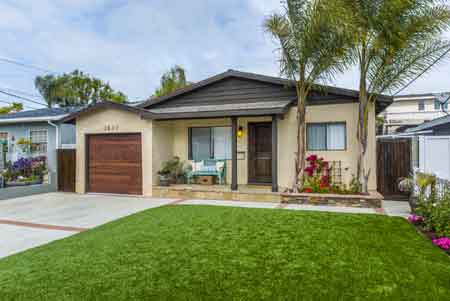
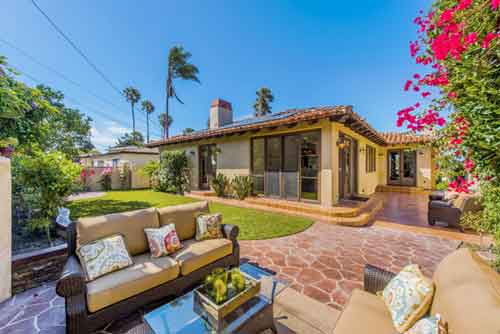
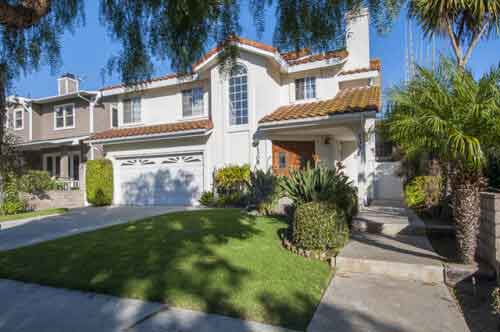
  Redondo Beach and the proximity to the ocean means milder weather and great ocean breezes that other parts of the city don’t enjoy. Comprised mainly of 1940s and 1950s beach style bungalows, the area is still more affordable than some of the nearby beach cities while still having a certain charm lost in some of these other areas with oversized homes, makes a statement type architecture and over development. Some homes have gone the route of maximum square footage, but the majority still look like homes that belong in the neighborhoods and give homeowners a bit of space and separation. Although prices are still below neighboring South Redondo, they have risen dramatically in the past 2 years with most original smaller 3 bed/1 bath homes starting in the mid to low $600’s for fairly original, but nice condition, and the larger 3 bed/2 bath 1400 foot (many homes added a family room accounting for the extra square footage) selling anywhere from the mid to low $700s up to the low $900’s depending on location and condition.