• Home
  • FREE Email Listing Updates
  • Search for Homes
    • Search The MLS
    • Search All Torrance
    • Search By Map
    • West Torrance
    • Southwood
    • South Torrance
    • Hollywood Riviera
    • North Torrance
    • Old Torrance
    • Central Torrance
    • South East Torrance
    • Marble Estates
    • Walteria and Victoria Knolls
    • County Strip/ Harbor Gateway
    • Plaza Del Amo
    • Foreclosures
    • South Bay homes & real estate
  • Search by Price
    • Below $350,000
    • $350,000 – $450,000
    • $450,000 – $550,000
    • $550,000 – $650,000
    • $650,000 – $750,000
    • $750,000 – $850,000
    • $850,000 – $1,050,000
    • Above $1,050,000
  • Sellers
    • What is my Home Worth?
    • How We Sell
    • Quick Home Valuation
    • Recent Home Sales
    • Quick Valuation
  • Market News
  • About
    • Your Torrance Realtor
      • Client Testimonials
      • Vista Sotheby’s
      • Contact Us – Torrance Realtor Keith Kyle of Vista Sotheby’s
      • Search for Homes by Torrance Neighborhood
      • The Cities in the South Bay
      • Our Google+ Profile
      • Home Selling Process
    • Torrance Unified Schools – Great Schools Make for Great Neighborhoods
    • Recent Torrance Sales & Home Prices
    • Market Trends
      • Hollywood Riviera
      • West Torrance
      • Walteria
      • Old Torrance
      • North Torrance West
  • Neighborhoods
    • Torrance Schools
    • Neighborhood Map
    • West Torrance
    • Southwood
    • Hollywood Riviera
    • Walteria & Victoria Knolls
    • South Torrance
    • Old Torrance
    • North Torrance
    • Plaza Del Amo
    • Central Torrance
    • 55+ Senior Communities
    • Souoth Bay and Palos Verdes

Torrance real estate and homes for sale

Keith Kyle - Vista Sotheby's International

July 2014 Median Home Prices in Torrance CA

September 8, 2014 by Keith Kyle

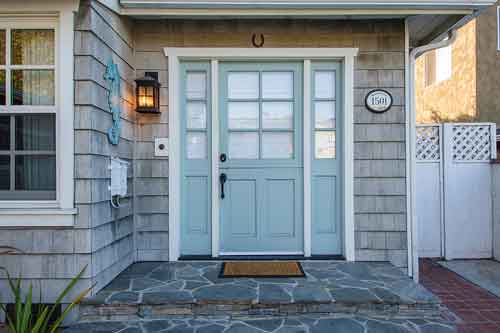
By Keith KyleWelcome home doorway

July 2014 saw some big numbers in terms of both number of homes sold as well as median prices.  Torrance CA  had 142 sold homes at a median price of $540,000 which was down from the same month in 2013.  Most other South Bay cities also saw some significant year over year increases in prices with the other exceptions being  Marina Del Rey and Playa Del Rey.  To see the actual homes sales in each city visit our recent home sales price and information site.

City Homes Sold July 2014 Median July 2013 Median Year over Year % Change
Carson 48 $382,500 $350,000 9.29%
El Segundo homes 15 $872,000 $797,000 9.41%
Gardena 50 $385,000 $332,500 15.79%
HarborCity 13 $480,000 $465,000 3.23%
Hawthorne real estate 51 $505,000 $400,000 26.25%
Hermosa Beach homes 26 $1,230,000 $1,097,500 12.07%
Lawndale 8 $412,000 $331,250 24.38%
Lomita 13 $555,000 $452,000 22.79%
Long Beach 330 $400,000 $365,000 9.59%
Manhattan Beach homes 43 $1,795,000 $1,521,250 18.00%
Marina Del Rey 33 $757,500 $862,500 -12.17%
Palos Verdes Estates 51 $1,600,000 $1,291,000 23.93%
Playa Del Rey 23 $507,000 $512,000 -0.98%
RanchoPalos Verdes 54 $1,069,000 $1,100,000 -2.82%
Redondo Beach homes 97 $865,000 $758,000 14.12%
San Pedro 49 $440,000 $420,500 4.64%
Torrance 142 $540,000 $576,250 -6.29%
Westchester 48 $777,500 $715,000 8.74%

Filed Under: Home Prices, Torrance CA real estate market, Torrance Real Estate, Torrance real estate trends Tagged With: homes for sale, median home prices, number of sold homes, prices, real estate, torrance, torrance ca

  • FREE Listing Updates
  • What’s Your Home Worth?
  • Search Torrance CA Homes For Sale