Featured home in Old Torrance
This new listing just hit the market and we love it. Although it’s almost 100 years old it’s obviously been meticulously maintained and beautifully remodeled. It’s on the smaller side with only 2 bedrooms and approximately 1,264 square feet so the price is on the high side for what it is, but the house offers great curb appeal and charm and there will certainly be loads of interest.
2358 Sonoma St Basics
- 2 bedrooms
- 2 bathrooms
- 1,264 square feet (BTV)
- 4,500 foot lot
- Built in 1928
- Listed by Joshua Hammond – Compass -310-241-3038
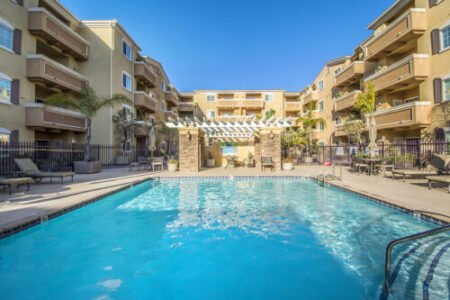 not really on Hawthorne Blvd) it’s in a great location. The building is central to everything and shopping and dining is just steps away. The building is newer, built in 2005 by Anastasi, and still has the features that you’ll find in new construction. The building offers a beautiful pool and spa area, billards room, fitness center and more. The unit is a rare 3 bedroom with over 1,300 square feet.
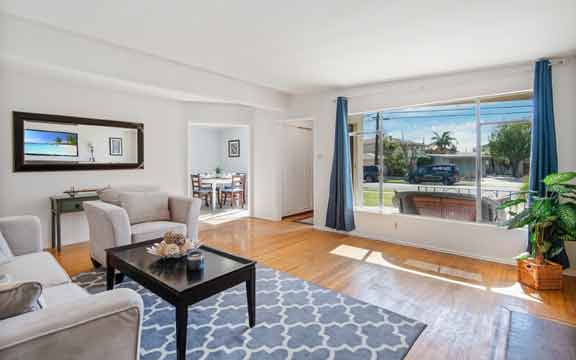
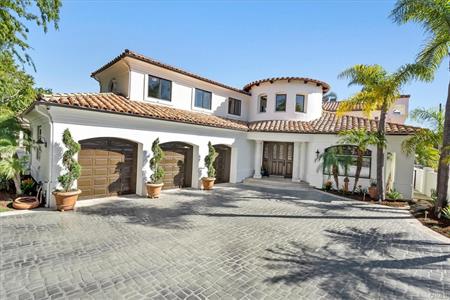 spacious 8,565 sq foot lot, the home offers impressive indoor and outdoor areas in one of the most sought after neighborhoods in all of the South Bay.
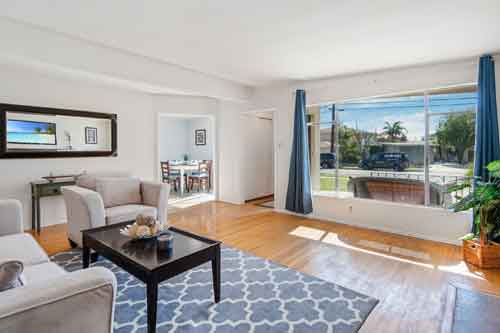 during February. We saw 76 on MLS closed home sales which was a big drop from December in which there were 111 sold homes but a slight uptick from the 73 closed sales in January.