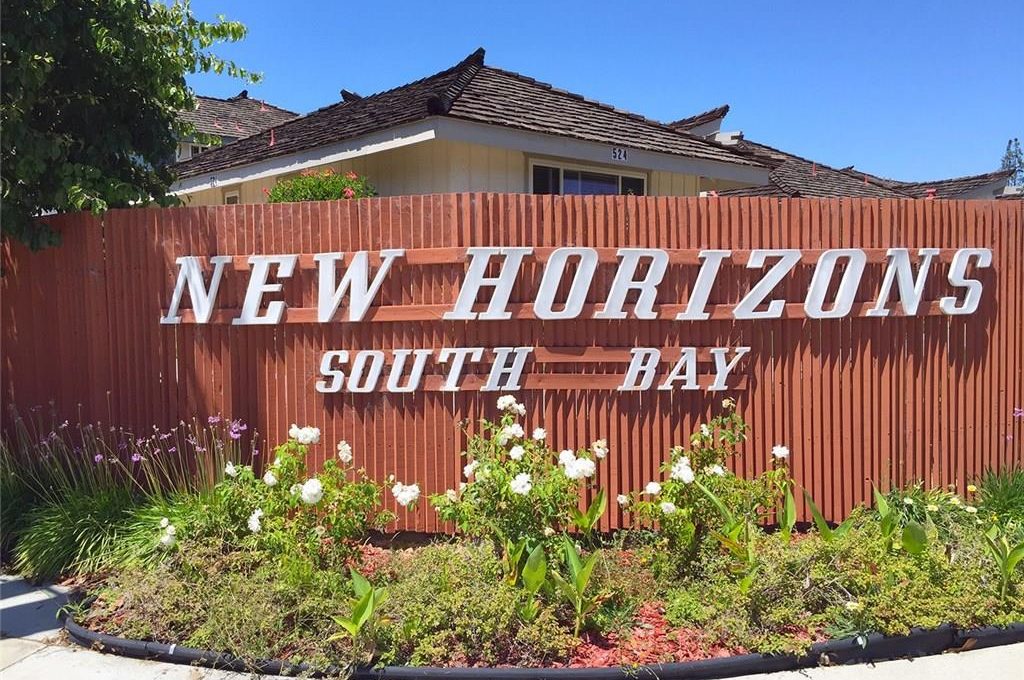
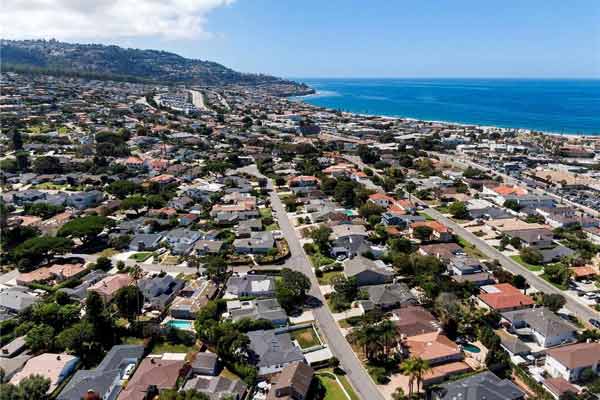
New Horizons 55+ Senior Community in Central Torrance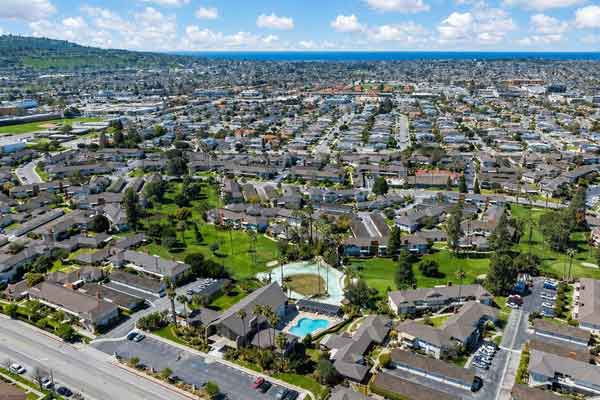
View the current homes for sale in New Horizons.
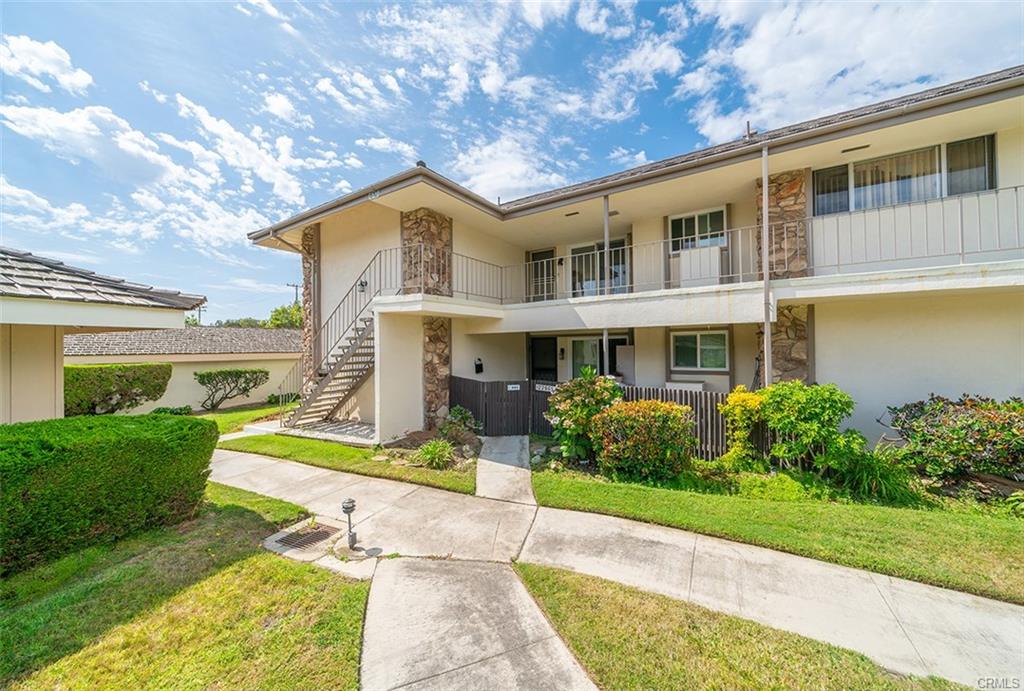
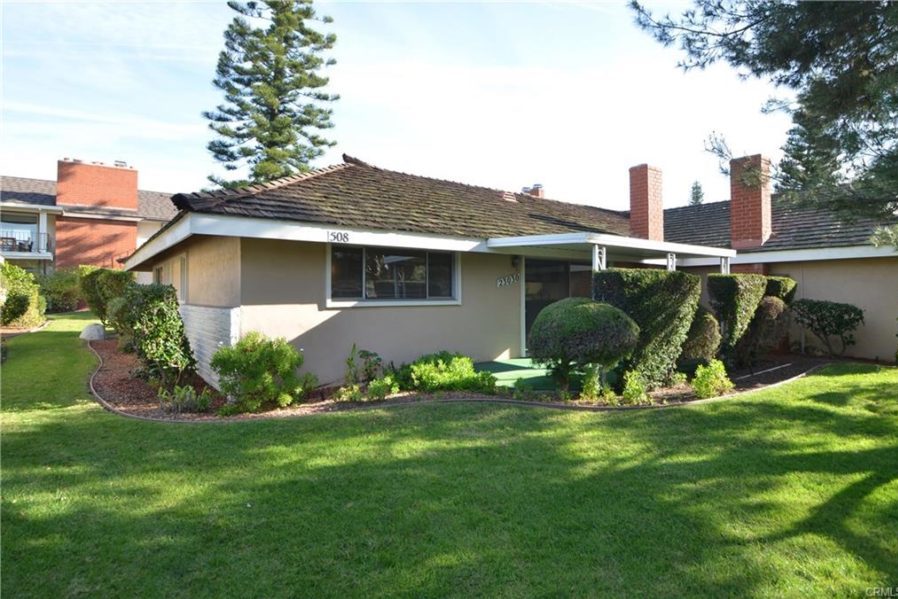
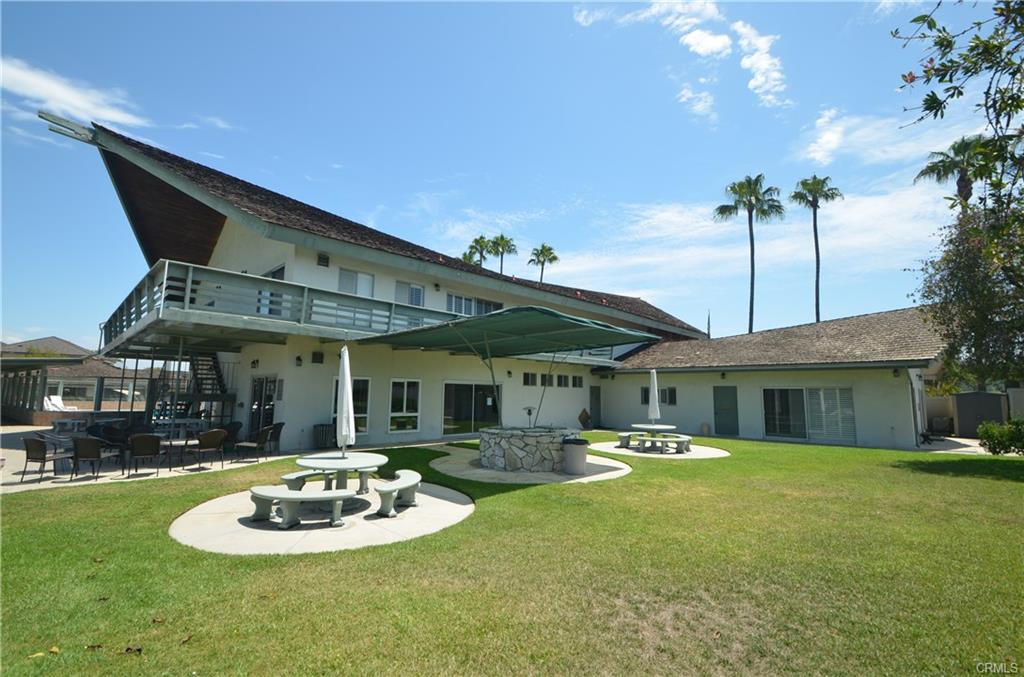
There are 600 total units broken into smaller buildings with both 2 level condo style buildings as well as single level patio home type housing. Although some of the homes are listed and sold as one bedrooms they have a living room/den area often converted and used as a second bedroom. The bulk of the homes are listed as two bedrooms and square footage ranges from 950-1117 square feet so all homes are fairly good size. HOA dues (as of 11/7/25) are around $540 a month.
The complex and homes were built in 1963 so the community does have a dated look and feel, but prices are great for what they offer compared to what they would be if not restricted to seniors. View also all 55+ homes for sale in the South Bay
Current Senior Homes for Sale in New Horizons Torrance
This web site may reference real estate listing(s) held by a brokerage firm other than the broker and/or agent who owns this website. The accuracy of all information is deemed reliable but not guaranteed and should be personally verified through personal inspection by and/or with the appropriate professionals
 limited number of homes here and it’s truly a showcase location.
 single family homes. The median list price for the closed sales was $1,200,000 with the median sales price of $1,177,500 indicating that it is still a solid seller’s market. That does seem to be shifting somewhat with the playing field leveling just a bit. The least expensive home sale during October was $820,000 for a 3 bedroom, 2 1/2 bath single family home at 4414 Highgrove and the most expenseive sale of the month was a Louis Tomaro designed home at
 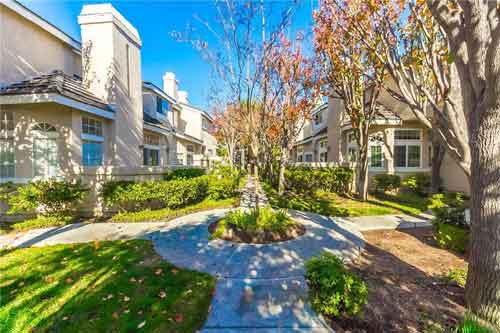 inTorrance that are similar there is no concentration of these single family, townhome and condo communities anywhere else. It’s really a real estate market unto itself in the heart of Torrance.