Beachfront homes in the Hollywood Riviera don’t come along all that often. If you’re looking for something out of the ordinary, 505 Paseo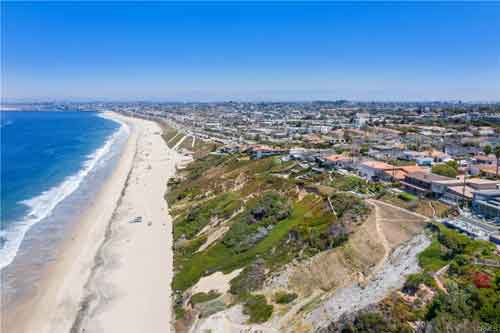 De La Playa might be the home and location for you. The home is listed at $5,500,000 this is a 4 bedroom (one bedroom downstairs and 3 upstairs), 3 bath home with just under 3,200 square feet. Offering really large (by South Bay standards) lots that extend all the way from Paseo De La Playa to the sands of Torrance Beach they are very unlike the beachfront homes of the Manhattan Beach Strand and Hermosa Strand, It’s rare to see one of these incredible oceanfront homes hit the market and this is no exception. Built in 1962 it’s an older home that feels pretty dated and will likely get/need quite a bit of work to become a luxury home, but as they say in real estate, “location, location, location”.
505 Paseo De La Playa
Details:
- 4 bedrooms
- 3 baths
- 3,179 square feet
- 26,985 foot lot
- Oceanfront
- Priced at $5,500,000
Contact us for more information or virtual tour

 sales in a month over the past 18 months other than December 2018 and 2019 (which is typically very slow) Prices were solid as they’ve been over the past 18 months with the median list prices of $717,500 and a median sales price of $700,000. Average price per foot for sold homes in Manhattan Beach was $532. Median days on market was only 13 which is incredibly low and is another indication of a strong sellers market.
  were 61 home sales/closed sales during the month which is considerably lower than the norm. Compare that with 101 sales in December, 90 in November and 119 in October and you can see just how slow it was.