• Home
  • FREE Email Listing Updates
  • Search for Homes
    • Search The MLS
    • Search By Map
    • Search by Zip Code
    • 55+ Senior Communities
    • Open Houses in Torrance
    • South Bay homes & real estate
  • Search by Neighborhood
    • All Torrance Listings
    • Old Torrance – 90501
    • West Torrance – 90503
    • South Torrance – 90505
    • Southwood – 90503
    • Central Torrance – 90503
    • Southeast Torrance – 90501 & 90505
    • North Torrance – 90504
    • Walteria and Victoria Knolls – 90505
    • Hollywood Riviera – 90277
    • Plaza Del Amo
    • Harbor Strip & Gateway – 90501
  • Search by Price
    • Below $450,000
    • $450,000 – $600,000
    • $600,000 – $750,000
    • $750,000-$900,000
    • $900,000-$1,100,000
    • $1,100,000-$1,250,000
    • $1,250,000-$1,500,000
    • Above $1,500,000
  • Sellers
    • What is my Home Worth?
    • How We Sell
    • Quick Home Valuation
    • Recent Torrance Property Prices
    • Quick Valuation
  • Market News
  • About
    • Neighborhoods
      • Torrance Schools
      • Neighborhood Map
      • West Torrance
      • Southwood
      • Hollywood Riviera
      • Walteria & Victoria Knolls
      • South Torrance
      • Old Torrance
      • North Torrance
      • Plaza Del Amo
      • Central Torrance
      • 55+ Senior Communities
      • South Bay and Palos Verdes
    • Your Torrance Realtor
      • Client Testimonials
      • Vista Sotheby’s
      • Contact Us – Torrance Realtor Keith Kyle of Vista Sotheby’s
      • Search for Homes by Torrance Neighborhood or Community Map
      • The Cities in the South Bay
      • Our Google+ Profile
      • Home Selling Process
    • Torrance Schools
    • Recent home sales and escrows
    • Market Trends
      • Hollywood Riviera
      • West Torrance
      • Walteria
      • Old Torrance
      • North Torrance West

Torrance real estate and homes for sale

Search for homes in Torrance CA

What’s Happening in Southwood? – Torrance Real Estate Update

March 15, 2020 by Keith Kyle

Like most areas in Torrance and the South Bay, the neighborhood of Southwood has been most impacted by a lack of home inventory.  As you can see from the chart below the number of sold homes has been declining just about every month since last summer.  The pending sales are very low with only 2 pending listings in each of the past three months.  That’s not surprising given that there were no new listings in Southwood for December or January.
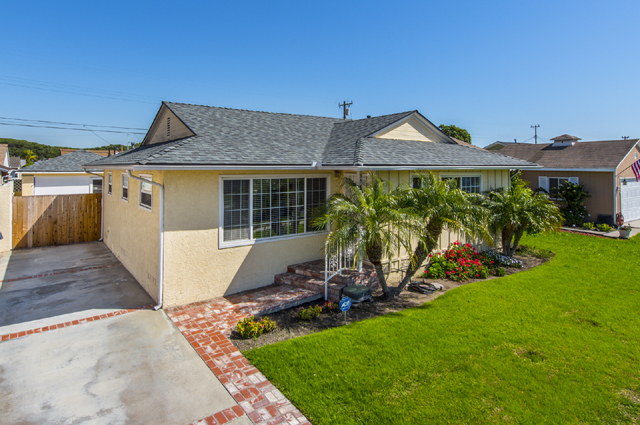
View the current homes for sale in Southwood

Current Southwood Homes for Sale

[idx-listings community=”130 – Southwood” statuses=”1″ orderby=”DateAdded” orderdir=”DESC” showlargerphotos=”true” listtabalignment=”Left”]
Filed Under: Southwood, Torrance CA real estate market, Torrance Real Estate, Torrance real estate trends Tagged With: homes in southwood torrance, southwood torrance homes, southwood torrance real estate

Torrance CA Home Sales and Prices for February 2020

March 5, 2020 by Keith Kyle

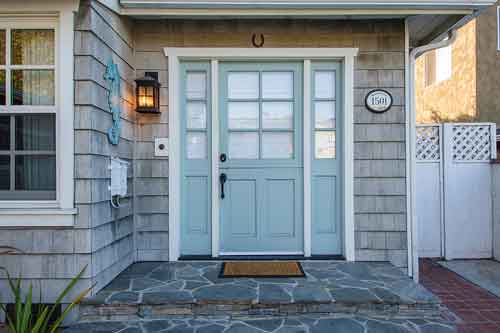
February was a slow month for closed home sales in Torrance Calfornia with only 71 homes sold during the month. That’s the fewest homeWelcome home doorway sales in a month over the past 18 months other than December 2018 and 2019 (which is typically very slow) Prices were solid as they’ve been over the past 18 months with the median list prices of $717,500 and a median sales price of $700,000.  Average price per foot for sold homes in Manhattan Beach was $532.  Median days on market was only 13 which is incredibly low and is another indication of a strong sellers market.  Old Torrance saw the most home sales with 10.   See the Torrance real estate stats for the past 15 months below.

View the current homes for sale in Torrance CA

February 2020 Home Sales and Prices in Torrance.

MLS # Type Address Price $ Per Foot Bed/Bath Sq Feet Year Sold Date
DW19263303 SFR/D 1604 W 226th ST $510,000 $675.50 2/1,0,0,0 755/A 1952/ASR 2/5/2020
20548890 SFR 21126 Denker AVE $580,000 $591.23 2/1,0,0,0 981/O 1952 2/26/2020
PW19193695 SFR/D 1302 Harmony WAY $659,000 $321.46 4/4,0,0,0 2050/A 2007/ASR 2/12/2020
OC20014416 SFR/D 20951 Halldale AVE $795,000 $519.61 4/2,0,0,0 1530/A 1951/ASR 2/21/2020
SW19148442 SFR/A 21405 S Normandie AVE $978,990 $364.89 4/4,0,0,0 2683/B 2018/BLD 2/21/2020
SB20022832 TWNHS/A 22330 Harbor Ridge LN #5 $400,125 $310.90 3/2,0,0,0 1287/A 1980/ASR 2/14/2020
SB20015190 CONDO/A 22232 S Vermont AVE #203 $405,000 $421.44 2/2,0,0,0 961/A 1985/ASR 2/27/2020
RS19282196 CONDO/A 20553 S Vermont AVE #1 $420,000 $433.88 2/0,2,0,0 968/A 1982/ASR 2/3/2020
19532922 SFR 21028 Royal BLVD $520,000 $594.29 2/1,0,0,0 875/ 1954 2/6/2020
SB20014741 SFR/D 1012 Clarion DR $590,000 $503.41 3/1,1,0,0 1172/A 1959/ASR 2/20/2020
SB20014479 SFR/D 20809 Orchard AVE $613,000 $523.04 3/2,0,0,0 1172/A 1961/ASR 2/5/2020
OC20016855 SFR/D 912 W 214th ST $695,000 $408.82 3/1,1,0,0 1700/A 1960/ASR 2/28/2020
SB19273083 SFR/D 23329 Berendo AVE $800,000 $300.98 5/1,2,0,0 2658/A 1969/ASR 2/11/2020
SB20013550 TWNHS/A 3718 Newton ST $654,000 $568.70 2/1,1,1,0 1150/A 2010/ASR 2/20/2020
SB20002097 SFR/D 4006 W 242nd ST $840,000 $889.83 2/1,0,0,0 944/A 1949/ASR 2/25/2020
19531970 CONDO 2605 SEPULVEDA #201 $455,000 $458.21 1/1,0,1,0 993/ 2003 2/5/2020
SB19271335 CONDO/A 2605 Sepulveda BLVD #208 $510,000 $428.21 2/1,1,0,0 1191/A 2003/ASR 2/27/2020
SB20017286 SFR/D 2360 Del Amo $540,000 $830.77 2/1,0,0,0 650/A 1948/ASR 2/21/2020
SB19287069 TWNHS/A 3520 Maricopa ST #22 $626,000 $453.62 2/1,1,1,0 1380/A 1975/ASR 2/11/2020
PV20010588 TWNHS/A 2800 Plaza Del Amo #368 $665,000 $561.18 2/2,0,1,0 1185/A 1987/ASR 2/12/2020
SB20013809 CONDO/A 2563 Plaza Del Amo #412 $680,000 $521.87 2/2,0,0,0 1303/A 1985/ASR 2/14/2020
SB19281927 TWNHS/A 2300 Maple AVE #58 $781,800 $454.27 3/2,0,1,0 1721/A 1989/ASR 2/13/2020
20543458 TWNHS 2300 MAPLE AVE #232 $845,000 $452.60 4/3,0,0,0 1867/ 1988 2/19/2020
SB20008579 SFR/D 1017 Teri AVE $915,000 $527.68 4/1,1,0,0 1734/A 1951/ASR 2/11/2020
SB20001457 TWNHS/D 2889 Plaza Del Amo #902 $970,000 $424.51 3/2,0,1,0 2285/A 2003/ASR 2/11/2020
SB19225885 CONDO/A 3120 Sepulveda BLVD #107 $355,000 $440.45 2/1,1,0,0 806/A 2002/ASR 2/21/2020
SB19242404 CONDO/A 22841 Nadine CIR #B $417,500 $373.77 2/1,1,0,0 1117/A 1963/ASR 2/6/2020
SB20021449 CONDO/A 3120 Sepulveda BLVD #209 $420,000 $521.09 2/2,0,0,0 806/A 2002/ASR 2/27/2020
PW19211301 CONDO/A 22631 Maple AVE #A $464,000 $488.42 2/1,0,1,0 950/A 1963/ASR 2/4/2020
SB19132807 CONDO/A 22605 Nadine Circle #200 $485,000 $501.55 2/1,0,1,0 967/P 1963/PUB 2/3/2020
SB19282413 CONDO/A 22730 Nadine CIR #A $492,000 $517.89 2/0,1,1,0 950/A 1963/ASR 2/21/2020
SB19214876 CONDO/A 22939 Nadine CIR #B $510,000 $456.58 2/2,0,0,0 1117/A 1963/APP 2/11/2020
SB20025306 SFR/D 2759 W 234th ST $944,000 $488.36 4/1,1,0,0 1933/A 1965/ASR 2/27/2020
SB20006563 SFR/D 4621 Greenmeadows AVE $1,129,000 $721.87 3/1,2,0,0 1564/A 1953/ASR 2/28/2020
SB19250168 SFR/D 5418 Calle De Arboles $1,345,000 $613.87 4/3,0,0,0 2191/A 1955/ASR 2/27/2020
SB19242072 SFR/D 4111 Paseo De Los Tortugas $1,550,000 $699.77 4/3,0,0,0 2215/A 1968/ASR 2/28/2020
PV20021775 SFR/D 22644 Gaycrest AVE $878,000 $1,068.13 2/1,0,0,0 822/A 1952/ASR 2/18/2020
SB20016005 SFR/D 5035 Avenue B $989,000 $506.66 3/2,0,0,0 1952/A 1952/ASR 2/21/2020
OC19217903 SFR/D 22602 Linda DR $1,000,000 $599.52 3/2,0,0,0 1668/A 1952/APP 2/12/2020
PV20015739 SFR/D 3928 W 234th PL $1,075,000 $514.35 4/2,0,0,0 2090/A 1962/ASR 2/27/2020
PV20011715 SFR/D 23517 Adolph AVE $1,190,000 $516.27 5/3,0,0,0 2305/A 1962/ASR 2/25/2020
SB20003535 SFR/D 5024 Macafee RD $1,250,000 $537.17 3/3,0,0,0 2327/A 2000/ASR 2/13/2020
SB20011927 SFR/D 5020 Laurette ST $1,130,000 $571.00 4/2,0,0,0 1979/A 1955/ASR 2/25/2020
SB20015221 SFR/D 19413 Donora AVE $965,000 $839.13 3/1,0,0,0 1150/A 1955/ASR 2/20/2020
SB19147236 SFR/D 3713 W 181st ST $625,000 $562.05 3/1,0,0,0 1112/A 1953/PUB 2/12/2020
TR19191215 SFR/D 18603 Crenshaw BLVD $645,000 $739.68 3/1,0,0,0 872/A 1951/ASR 2/12/2020
SB19278883 SFR/D 18301 Patronella AVE $797,000 $440.33 3/2,0,0,0 1810/A 1954/ASR 2/19/2020
SB19259179 SFR/D 3806 W 172nd ST $875,000 $570.03 3/2,0,0,0 1535/A 1955/ASR 2/10/2020
SB20020606 SFR/D 17202 Falda AVE $880,000 $425.33 3/2,0,0,0 2069/A 1948/ASR 2/26/2020
DW19281919 SFR/D 18035 Fonthill AVE $926,000 $315.07 5/4,0,0,0 2939/A 1954/ASR 2/25/2020
SB20003030 SFR/D 3355 W 175th ST $940,000 $505.38 3/2,0,0,0 1860/A 1950/APP 2/14/2020
SB19227558 SFR/D 18808 Van Ness AVE $692,500 $451.43 3/1,1,0,0 1534/A 1951/ASR 2/21/2020
SB20008812 SFR/D 2055 W 185th ST $700,000 $527.51 3/2,0,0,0 1327/A 1955/ASR 2/20/2020
SB20000008 SFR/D 18151 GRAMERCY PL $779,000 $641.15 3/1,1,0,0 1215/A 1957/ASR 2/28/2020
SB19283904 SFR/D 2521 W 168th ST $810,000 $537.49 3/2,0,0,0 1507/A 1953/PUB 2/11/2020
DW19287241 CONDO/A 1281 Cabrillo AVE #302 $410,000 $676.57 1/1,0,0,0 606/A 1993/ASR 2/28/2020
PW19134808 CONDO/A 911 Cota AVE #2 $475,000 $409.84 2/3,0,0,0 1159/A 1984/APP 2/21/2020
SB20014462 SFR/D 2019 W 220th ST $587,500 $807.01 2/1,0,0,0 728/A 1930/PUB 2/28/2020
DW19267326 SFR/D 2418 Del Amo BLVD $625,000 $686.81 3/1,0,0,0 910/A 1948/ASR 2/11/2020
PW20001578 TWNHS/A 1833 Cabrillo AVE $690,000 $575.00 2/2,0,1,0 1200/A 2011/ASR 2/13/2020
SB20002581 SFR/D 617 Cota AVE $726,000 $639.08 3/1,0,0,0 1136/A 1919/ASR 2/27/2020
SB19264034 SFR/D 606 Amapola AVE $740,000 $811.40 2/2,0,0,0 912/A 1947/ASR 2/5/2020
SB20009557 SFR/D 2362 Sierra ST $818,000 $464.77 3/2,0,1,0 1760/A 1988/ASR 2/21/2020
SB19245968 SFR/D 1729 Manuel AVE $875,000 $498.29 4/1,0,1,0 1756/A 1950/ASR 2/28/2020
TR20005423 SFR/D 2405 Santa Cruz CT $986,300 $377.03 4/3,0,0,0 2616/A 1977/ASR 2/19/2020
CV19232342 TWNHS/A 23903 Arlington AVE $490,000 $462.26 2/1,1,0,0 1060/A 1978/ASR 2/26/2020
SB19257855 CONDO/A 23418 Arlington AVE #1 $540,000 $385.44 3/1,1,0,1 1401/A 1973/ASR 2/24/2020
SB20009491 SFR/D 2269 W 233rd ST $850,000 $361.09 4/3,0,0,0 2354/A 1978/ASR 2/26/2020
SB20008302 SFR/D 2338 W 232nd ST W $879,000 $529.84 3/2,0,0,0 1659/A 1973/ASR 2/20/2020
DW19216620 CONDO/A 20425 S Vermont AVE #4 $380,000 $396.25 2/2,0,0,0 959/A 1980/ASR 2/14/2020
PW19266283 SFR/A 1655 W 216th ST $740,000 $508.24 4/2,0,0,0 1456/A 1944/ASR 2/7/2020

By the Number – Real Estate Stats for Torrance CA

View all real estate stats for Torrance

Filed Under: Buyers, Homes for Sale, Old Torrance, Torrance Real Estate, Torrance real estate trends, Torrance Realtors Tagged With: february home prices in torrance, february home sales in torrance, median home prices in torrance, old torrance homes, torrance home prices, torrance home sales, torrance homes for sale, torrance real estate

State of Torrance Real Estate Market As We Head into 2020

March 3, 2020 by Keith Kyle

Welcome to our Torrance real estate update for the coming year.   2020 is looking to be another banner year for home sellers as the combination of seemingly endless demand and historically low interest rates means more people will be looking to purchase a home.

View the current homes for sale in Torrance California.

In general the real estate market seems to be slowing down heading into 2020 but for a very odd reason…..each month there are fewer homes hitting the market.  Fewer listings mean fewer home sales.  January saw a very slight uptick in the number of listings so we’re hopeful that is a trend that continues.  Other than that small bump in January, the number of homes for sale has dropped every month since May of 2019

According to Torrance realtor Keith Kyle, “It’s clear that the market is cooling off as there has been an increase in new listings coupled with fewer sales and homes going into escrow since summer.”  The chart above shows that the number of active listings has held pretty steady between 150 and 170 since summer, but the number of sold homes as well as new escrows has continued to decrease.  If this trend continues the market will shift more in favor of buyers and less in favor of sellers.  It’s clearly been a sellers market over the past few years.

The chart below shows the upward trend over the past few months with avarage “months of inventory” of unsold homes on the rise.

Filed Under: Buyers, Escrow Process, First Time Buyers, Home Prices, Homes for Sale, Interest rates, Old Torrance, Torrance CA real estate market, Torrance Real Estate, Torrance real estate trends Tagged With: home prices in torrance, home sales in torrance, homes for sale in torrance, torrance real estate 2020, torrance real estate trends

Torrance Real Estate Market By the Numbers – January Home Sales and Prices

February 6, 2020 by Keith Kyle

As is fairly typical of the real estate market after the holidays, January was a pretty slow month in terms of home sales in Torrance.  There were 61 home sales/closed sales during the month which is considerably lower than the norm.  Compare that with 101 sales in December, 90 in November and 119 in October and you can see just how slow it was.
The median price of the “active” homes for sale  in Torrance was $775,000 with the median price of the homes that sold at $770,000.  Median price per foot was $526.18 and homes only averaged 28 days on the market before selling.    There were quite a few condo sales both in the Plaza Del Amo area as well as a few 55+ sales in Village Court and New Horizons senior communities.

January Torrance Home Sales and Home Prices

Type Address Price $ Per Sq Foot Bed/Bath Sq Feet Year Sold Date
TWNHS/A 1444 W 227th ST #5 $256,000 $233.36 2/2,0,0,0 1097/A 1982/ASR 1/23/2020
CONDO/A 3120 Sepulveda BLVD #116 $290,000 $551.33 1/1,0,0,0 526/A 2002/PUB 1/27/2020
CONDO/A 941 W Carson ST #221 $300,000 $431.03 1/1,0,0,0 696/A 1982/ASR 1/15/2020
CONDO 24410 Crenshaw BLVD #112 $305,000 $410.50 1/1,0,0,0 743/ 1987 1/31/2020
CONDO/A 941 W Carson ST #215 $305,000 $438.22 1/1,0,0,0 696/A 1982/ASR 1/3/2020
CONDO/A 3550 Torrance BLVD #106 $355,000 $622.81 1/1,0,0,0 570/A 2006/ASR 1/31/2020
CONDO/A 23306 Marigold AVE #W101 $375,000 $436.55 2/1,1,0,0 859/A 1973/ASR 1/16/2020
CONDO 23230 SESAME ST #10-H $382,000 $448.36 2/2,0,0,0 852/ 1973 1/17/2020
CONDO/A 1507 W 227th ST #A $425,000 $373.46 3/3,0,0,0 1138/A 2003/ASR 1/27/2020
CONDO/A 23051 Nadine CIR #A $450,000 $473.68 1/1,1,0,0 950/A 1963/PUB 1/3/2020
CONDO/A 23030 Nadine CIR $485,000 $510.53 2/1,0,1,0 950/A 1963/ASR 1/31/2020
SFR/D 20721 Raymond AVE $499,000 $739.26 2/1,0,0,0 675/A 1951/PUB 1/9/2020
CONDO/A 21345 Hawthorne Blvd. #413 $510,000 $520.94 1/1,0,0,0 979/A 2005/ASR 1/29/2020
CONDO/A 3230 Merrill DR #46 $511,000 $411.10 2/1,1,0,0 1243/A 1964/ASR 1/9/2020
TWNHS/A 1660 W 220th ST #3 $520,000 $356.16 3/2,0,1,1 1460/A 1990/ASR 1/14/2020
CONDO/A 23037 Nadine CIR #535 $522,000 $539.81 2/2,0,0,0 967/A 1963/PUB 1/31/2020
TWNHS/A 22919 Mariposa AVE #203 $538,000 $356.29 3/3,0,0,0 1510/A 2009/ASR 1/6/2020
SFR/D 1031 W 227th ST $560,000 $580.91 3/1,0,0,0 964/A 1954/ASR 1/9/2020
SFR/D 1065 W 209th ST $570,000 $591.90 3/1,0,0,0 963/A 1953/ASR 1/9/2020
SFR/D 21203 Marigold AVE $595,000 $517.39 3/1,1,0,0 1150/A 1959/ASR 1/31/2020
TWNHS/A 2931 Plaza Del Amo #75 $623,000 $526.18 2/2,0,1,0 1184/A 1985/ASR 1/6/2020
CONDO/A 2971 Plaza Del Amo #301 $647,000 $475.39 2/2,0,1,0 1361/A 1985/ASR 1/14/2020
SFR/A 1305 Harmony WAY $650,000 $317.07 4/4,0,0,0 2050/A 2007/ASR 1/22/2020
SFR/A 21408 Normandie AVE $660,000 $404.66 3/2,0,0,0 1631/A 1959/ASR 1/10/2020
TWNHS 16609 Yukon AVE #115 $735,000 $465.48 3/2,0,1,0 1579/ 2004 1/17/2020
SFR/D 2022 W 177TH STREET $740,000 $450.94 3/1,1,0,0 1641/A 1953/ASR 1/14/2020
SFR/D 17019 Van Ness AVE $745,000 $621.87 3/1,1,0,0 1198/A 1955/PUB 1/23/2020
SFR/D 16506 Spinning AVE $750,000 $643.22 3/0,2,0,0 1166/A 1954/ASR 1/14/2020
SFR/D 4830 Theo AVE $760,000 $721.75 3/1,0,0,0 1053/A 1953/ASR 1/15/2020
SFR/D 709 W 227th PL $765,000 $218.14 5/2,1,0,0 3507/A 1969/ASR 1/10/2020
SFR/D 2806 El Dorado ST $770,000 $610.63 3/1,0,0,0 1261/A 1951/ASR 1/13/2020
SFR/D 2100 W 236th ST $775,000 $591.60 3/2,0,0,0 1310/A 1952/ASR 1/31/2020
SFR/D 23823 Pennsylvania AVE $800,000 $624.02 3/2,0,0,0 1282/A 1952/ASR 1/29/2020
SFR/D 1420 Acacia AVE $814,500 $445.57 3/2,0,0,0 1828/A 1928/ASR 1/3/2020
SFR/D 2829 Onrado ST $818,000 $740.94 3/1,0,0,0 1104/A 1951/ASR 1/14/2020
TWNHS/A 2801 Sepulveda BLVD #126 $820,000 $434.09 3/2,0,0,0 1889/A 1996/ASR 1/17/2020
SFR/D 1803 Schilling CT $825,000 $505.51 4/2,0,0,0 1632/A 1950/PUB 1/16/2020
SFR/D 2270 W 231st ST $825,000 $501.52 3/2,0,0,0 1645/A 1953/ASR 1/6/2020
SFR/D 2607 W 178th St $830,000 $655.61 3/2,0,0,0 1266/A 1953 1/23/2020
CONDO/D 2411 Border AVE #B $835,000 $422.14 3/3,0,0,0 1978/A 2002/ASR 1/22/2020
SFR/D 1615 Juniper AVE $839,000 $682.11 2/1,0,0,0 1230/A 1949/ASR 1/2/2020
SFR/D 2084 W 166th ST $905,000 $427.90 3/2,0,0,0 2115/A 1979/ASR 1/17/2020
SFR/D 1023 Acacia AVE $905,000 $765.00 3/2,0,0,0 1183/A 1945/ASR 1/30/2020
SFR/D 16823 Glenburn AVE $910,000 $424.64 4/3,0,0,0 2143/A 1954/ASR 1/10/2020
SFR/D 25254 Denny RD $925,000 $421.99 4/2,0,1,0 2192/A 1997/ASR 1/29/2020
TWNHS/D 1730 Iris AVE $925,000 $426.27 4/2,1,0,0 2170/A 1995/ASR 1/21/2020
SFR/D 4736 Reese Road RD $970,000 $683.10 3/1,0,1,0 1420/S 1956/PUB 1/10/2020
SFR/D 5202 Carmen ST $975,000 $839.07 3/1,1,0,0 1162/A 1955/ASR 1/10/2020
SFR/D 4808 Merrill ST $984,000 $810.54 3/2,0,0,0 1214/A 1955/ASR 1/6/2020
SFR/D 23813 Ladeene AVE $1,020,000 $530.42 4/2,0,0,0 1923/A 1962/ASR 1/28/2020
SFR/D 22314 Susana AVE $1,049,000 $912.17 3/2,0,0,0 1150/A 1952/ASR 1/30/2020
SFR/D 3859 Newton ST $1,083,000 $576.68 3/1,1,0,0 1878/A 1946/ASR 1/17/2020
SFR/D 25610 Amber Leaf RD $1,149,000 $679.08 3/2,0,0,0 1692/A 1976/ASR 1/6/2020
SFR/D 5209 Laurette ST $1,150,000 $725.09 3/2,0,0,0 1586/A 1955/ASR 1/14/2020
SFR/A 4731 Konya DR $1,150,000 $547.62 4/2,1,0,0 2100/O 1960/ASR 1/3/2020
SFR/D 4242 Mesa ST $1,232,300 $535.78 3/1,1,1,0 2300/A 1976/ASR 1/24/2020
SFR/D 19433 Sturgess DR $1,249,000 $692.73 4/1,1,0,0 1803/A 1956/ASR 1/9/2020
SFR/D 2811 Dalemead ST $1,310,000 $494.15 4/3,0,0,0 2651/A 2004/APP 1/9/2020
SFR/D 3637 Courtney WAY $1,350,000 $543.26 4/3,0,0,0 2485/A 1976/ASR 1/2/2020
SFR/D 3538 Senefeld DR $1,450,000 $671.30 3/3,0,0,0 2160/A 1949/PUB 1/7/2020
SFR/D 22727 Benner AVE $1,450,000 $607.20 5/3,0,0,0 2388/A 1963/ASR 1/3/2020

Chart Showing the Number of Home Sales in Torrance Over the Past 13 Months


Filed Under: Home Prices, Homes for Sale, Plaza Del Amo, Torrance Real Estate Tagged With: home prices in torrance ca, home sales in torrance, january home sales, torrance home prices

Community Spotlight – New Horizons 55+ Senior Housing

February 4, 2020 by Keith Kyle

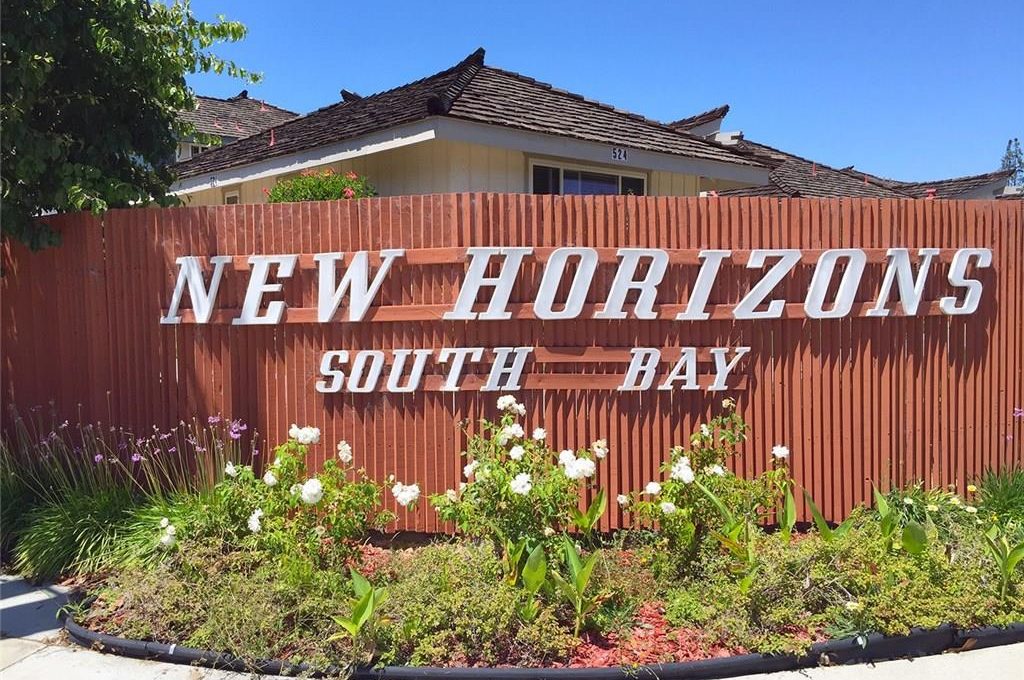
New Horizons 55+ Senior Community in Central Torrance

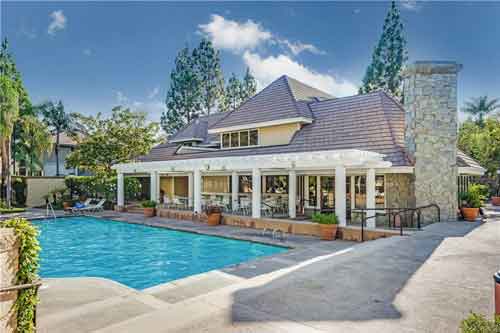
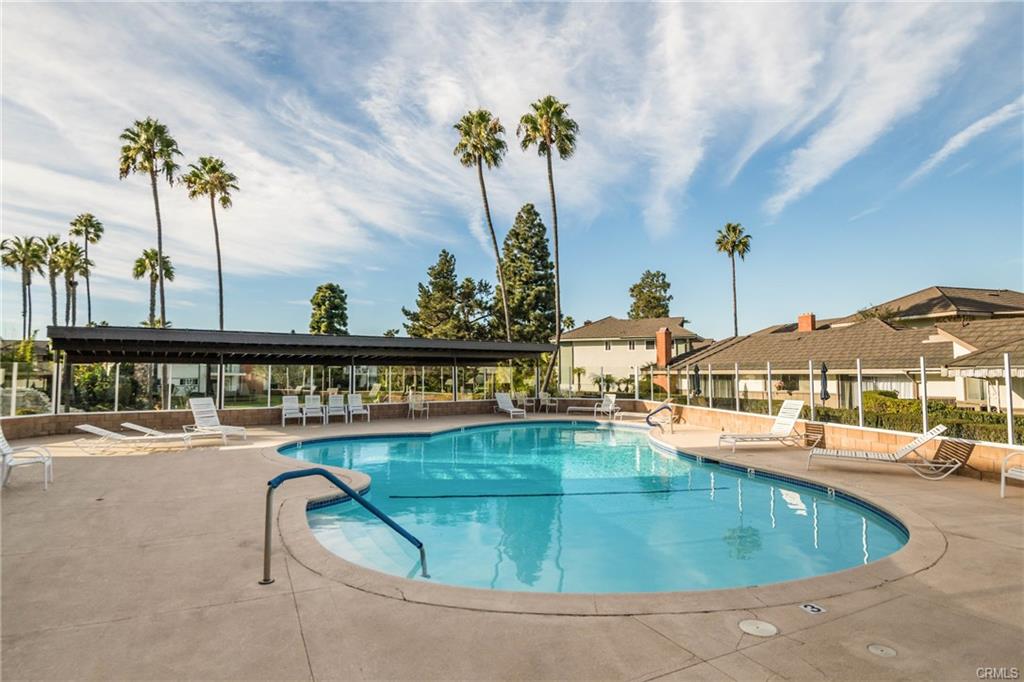
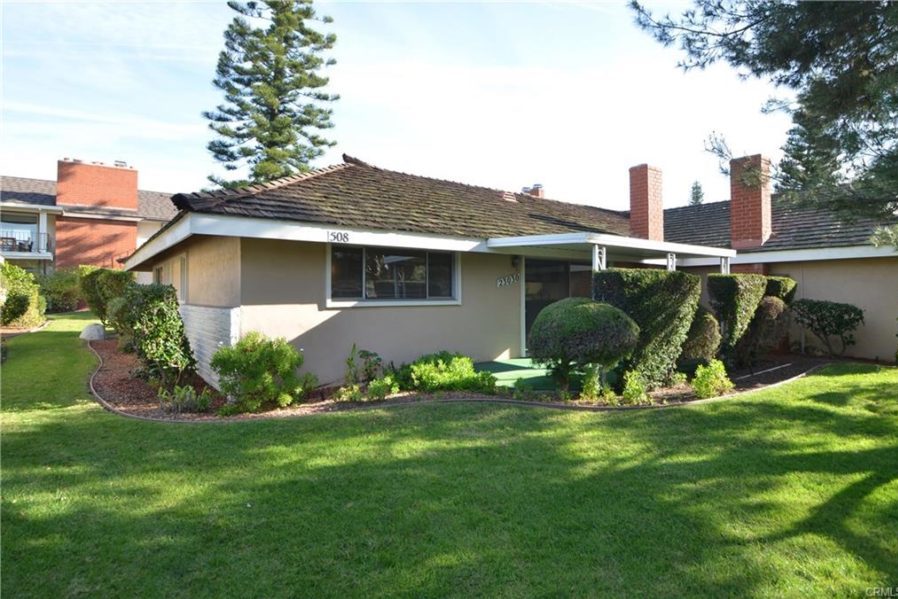
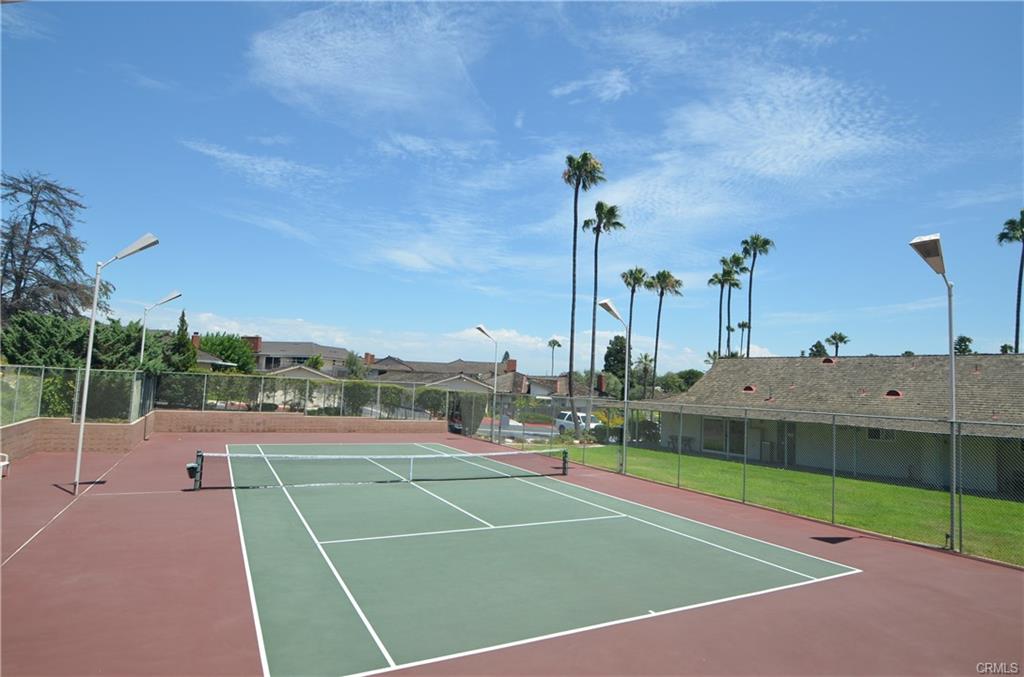
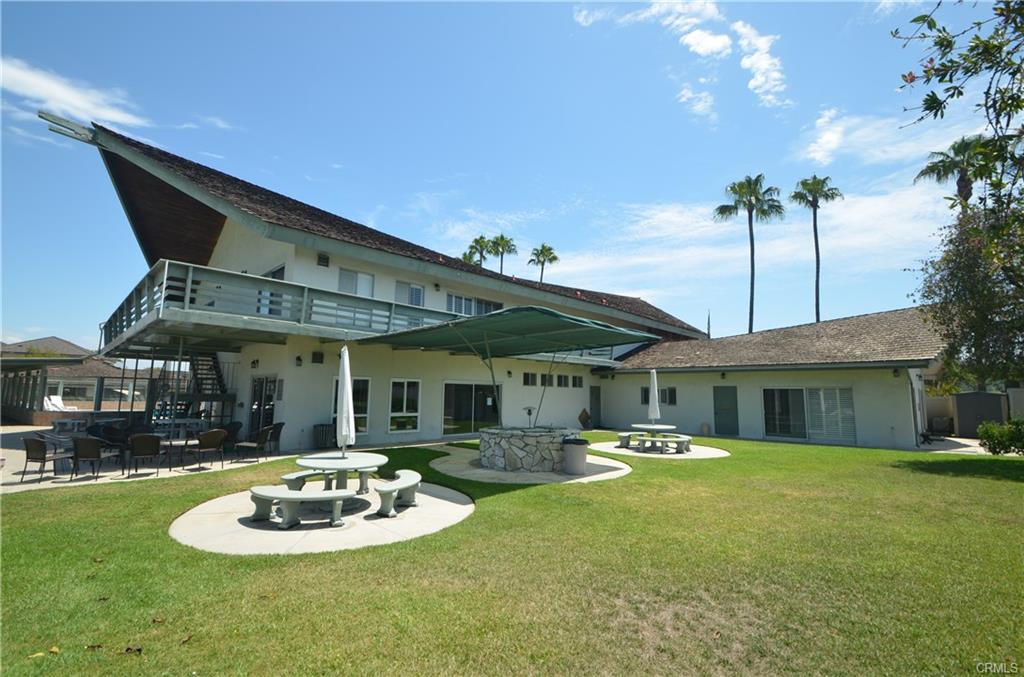
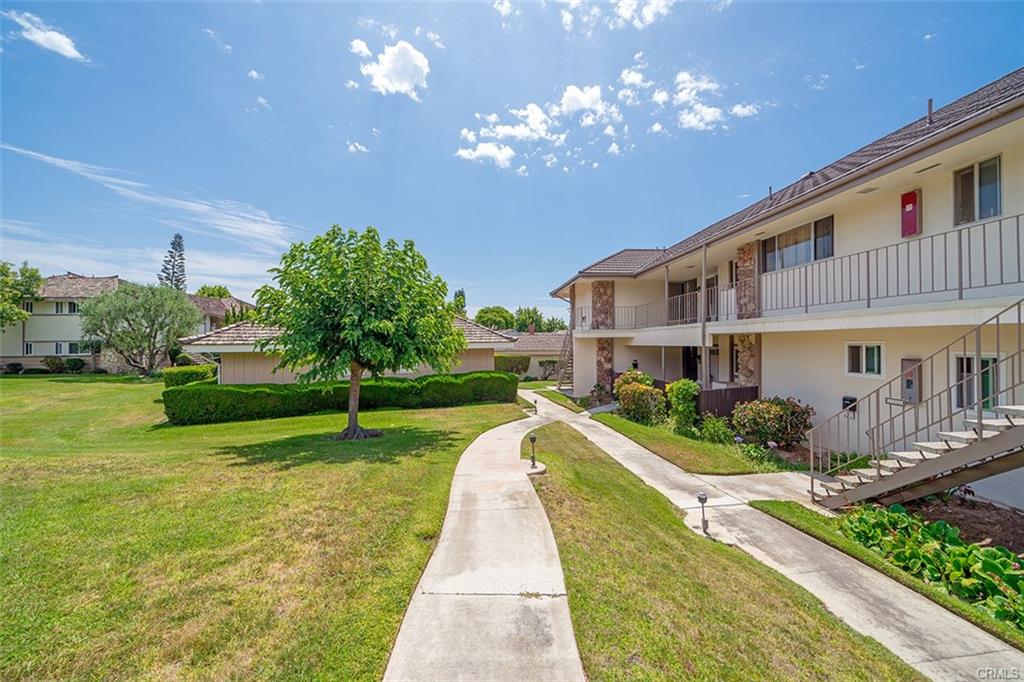
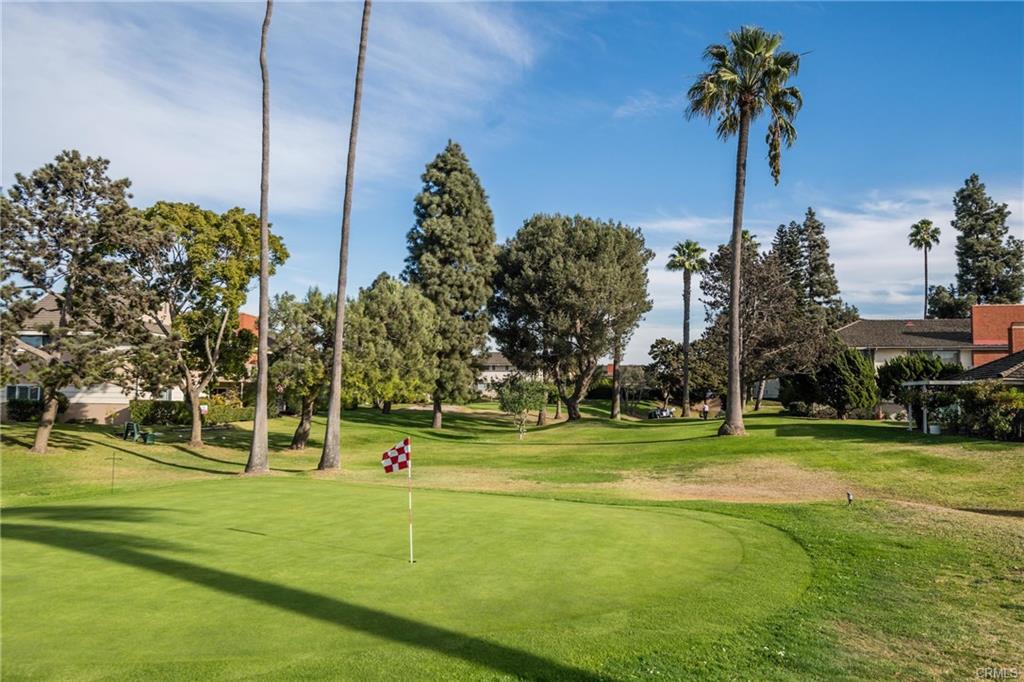
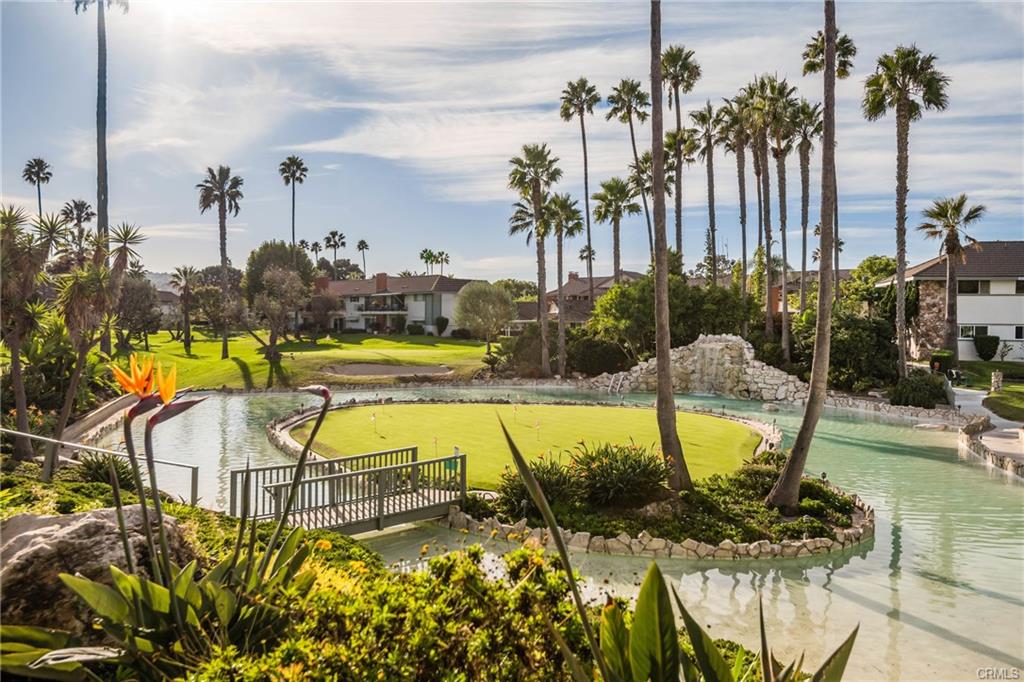
Welcome to the 55+ community of New Horizons in southeast Torrance.   This is the largest senior living community in the South Bay and boasts a look and feel of a Florida type senior community.  The area and grounds offer an active lifestyle with 9-hold golf, swimming pool, tennis courts, a gym and more.  It’s an easy place to be social as well with a billiards room, art room, clubhouse, picnic/BBQ areas, ballroom and more.  It really does offer resort style living at a fraction of the cost of nearby non 55+ communities.

View the current homes for sale in New Horizons.

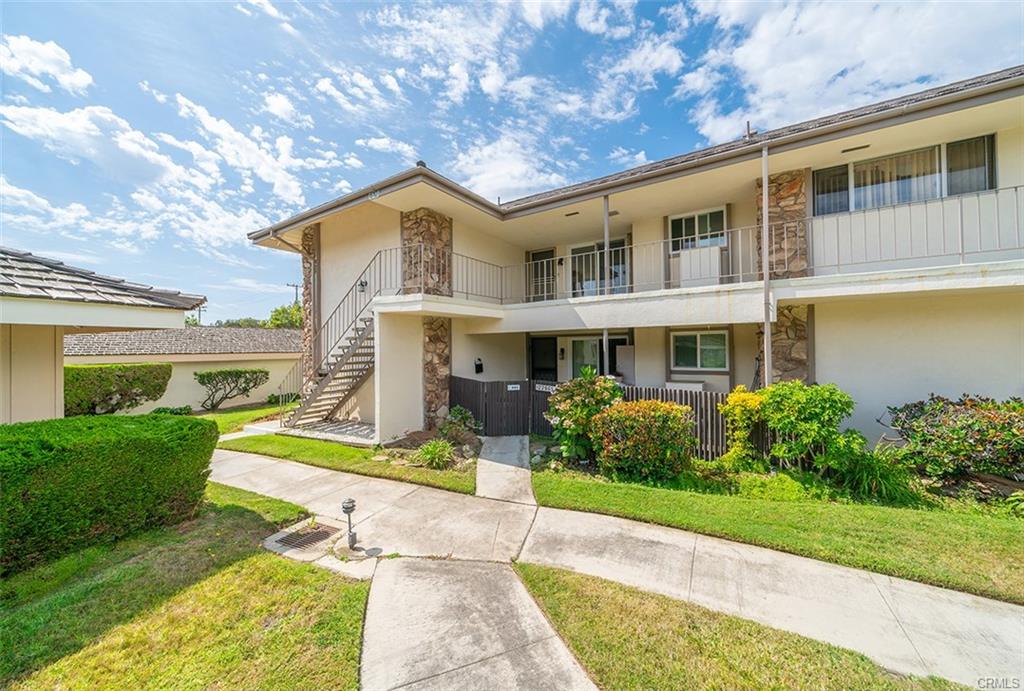
There are 600 total units broken into smaller buildings with both 2 level condo style buildings as well as single level patio home type housing.  Although some of the homes are listed and sold as one bedrooms they have a living room/den area often converted and used as a second bedroom.  The bulk of the homes are listed as two bedrooms and square footage ranges from 950-1117 square feet so all homes are fairly good size.  HOA dues (as of 4/7/24) are around $495 a month.

The complex and homes were built in 1963 so the community does have a dated look and feel, but prices are great for what they offer compared to what they would be if not restricted to seniors.  View also all 55+ homes for sale in the South Bay


Current Senior Homes for Sale in New Horizons Torrance

Filed Under: 55+ Homes in Torrance, Home Prices, Homes for Sale Tagged With: golf course homes, new horizons 55+, new horizons senior housing, senior communities in the south bay, torrance senior housing

What Exactly Is Debt To Income Ratio

February 3, 2020 by Keith Kyle

One of the key items that a lender takes into consideration when you’re getting pre approved for a loan and during the underwriting process is your debt to income ratio. This tells the lender how much money you owe each month compared with your monthly income to come up with a ratio to determine how much of a risk you are to them.  This ratio comes from adding up all of your debts including mortgages, auto laons, student loans, credit card balances and any other debt you pay off each month to your pre-tax income each month. Lenders have different thresholds that they’ll allow so it’s always good to talk with several lenders.  If you’re not comfortable getting the process started we would be happy to give you several lenders that we’ve worked with and that have earned our trust.

Debt to income infographic

Filed Under: Buyers, Escrow Process, First Time Buyers, home loan process, Interest rates Tagged With: debt to income ratio, first time buyers, getting the loan process started, home loan process, home loans, lending process

  • « Previous Page
  • 1
  • …
  • 7
  • 8
  • 9
  • 10
  • 11
  • …
  • 35
  • Next Page »
  • FREE Listing Updates
  • What’s Your Home Worth?
  • Search Torrance CA Homes For Sale and Current Listings