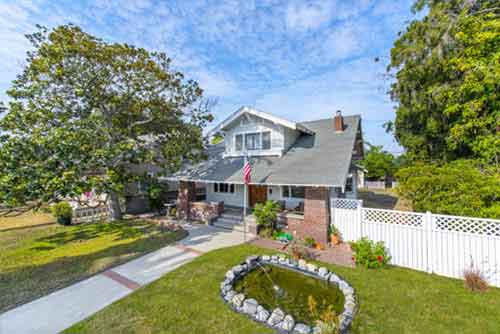
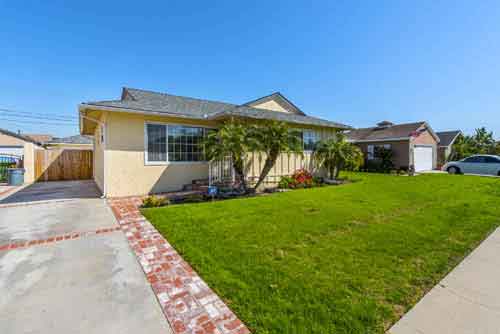
• Home
  • FREE Email Listing Updates
  • Search for Homes
    • Search The MLS
    • Search By Map
    • Search by Zip Code
    • 55+ Senior Communities
    • Open Houses in Torrance
    • South Bay homes & real estate
  • Search by Neighborhood
    • All Torrance Listings
    • Old Torrance – 90501
    • West Torrance – 90503
    • South Torrance – 90505
    • Southwood – 90503
    • Central Torrance – 90503
    • Southeast Torrance – 90501 & 90505
    • North Torrance – 90504
    • Walteria and Victoria Knolls – 90505
    • Hollywood Riviera – 90277
    • Plaza Del Amo
    • Harbor Strip & Gateway – 90501
  • Search by Price
    • Below $450,000
    • $450,000 – $600,000
    • $600,000 – $750,000
    • $750,000-$900,000
    • $900,000-$1,100,000
    • $1,100,000-$1,250,000
    • $1,250,000-$1,500,000
    • Above $1,500,000
  • Sellers
    • What is my Home Worth?
    • How We Sell
    • Quick Home Valuation
    • Recent Torrance Property Prices
    • Quick Valuation
  • Market News
  • About
    • Neighborhoods
      • Torrance Schools
      • Neighborhood Map
      • West Torrance
      • Southwood
      • Hollywood Riviera
      • Walteria & Victoria Knolls
      • South Torrance
      • Old Torrance
      • North Torrance
      • Plaza Del Amo
      • Central Torrance
      • 55+ Senior Communities
      • South Bay and Palos Verdes
    • Your Torrance Realtor
      • Client Testimonials
      • Vista Sotheby’s
      • Contact Us – Torrance Realtor Keith Kyle of Vista Sotheby’s
      • Search for Homes by Torrance Neighborhood or Community Map
      • The Cities in the South Bay
      • Our Google+ Profile
      • Home Selling Process
    • Torrance Schools
    • Recent home sales and escrows
    • Market Trends
      • Hollywood Riviera
      • West Torrance
      • Walteria
      • Old Torrance
      • North Torrance West

Torrance real estate and homes for sale

Search for homes in Torrance CA

Oh How Torrance Home Values Have Changed

October 19, 2014 by Keith Kyle

By Keith Kylepool-west-new

I received an odd phone call yesterday from a potential buyer that said she had been given a real estate flyer for a listing at 16808 Delia in North Torrance.  She said it was a well priced short sale and it was.  The only problem was that I sold this house at the beginning of 2012.  It had been a while since I thought of this house and upon pulling up the old listing I struck me just how dramatically the market has changed since then.  It was a very nice home, with a great yard and pool but unfortunately the owners were struggling and had to do a short sale.  We listed the home at $520,000 and it closed at $502,000.

What would it sell for now?

It would be just about impossible to find any single family home in that neighborhood, regardless of condition and size for that price in the current market.  That home that sold only 2 years ago would now sell for at least $750,000 which is simply incredible.  The speed with which the real estate market in Torrance and the South Bay was stunning and the changes to value equally unbelievable.

How Quickly we forget?

Another aspect of all this that struck me was just how short our memories can be.  Just 2 years ago there were so many homes with great prices and most buyers thought it would continue and go even lower.  These days the poor buyers that didn’t buy are priced completely out of neighborhoods that would have been very affordable.  The thought now is that it of course can only continue going up, but is that really the reality and has that much changed?  It’s certainly a great time to be a home seller, but not necessarily a great time to be a buyer.

[idx-listings community=”North Torrance West” statuses=”1″ propertytypes=”516″ orderby=”DateAdded” orderdir=”DESC” count=”10″]

Filed Under: Buyers, Home Prices, Short Sales and Foreclosures, Torrance CA real estate market, Torrance Real Estate, Torrance real estate trends Tagged With: Home values have changed dramatically in Torrance CA

Median home prices near $600,000 for August 2014

September 12, 2014 by Keith Kyle

By Keith KyleCraftsman homes in Old Torrance 90501

August was yet another big month for home prices in Torrance and the South Bay with  average home prices continuing to rise and the busy summer season continuing at a fairly torrid pace. Home sales were down from July due to the continuing lack of homes for sale.  Click any city and month below to see the full list of homes sold.  Contact us for more information on any of the homes.

August 2014 saw a total of 117 homes sold, down from 142 in July.  Of the 117 homes sold, 82 were single family homes, 16 were townhomes, and 17 were condos.  In addition there were 9 income properties (duplex, triplex, etc.) sold  as well as.  Of the 117 4 were short sales or foreclosures showing that the foreclosure market continues to dwindle and is a non factor in the current housing market.  The median home price was $600,000 up from $540,000 the prior month.


Filed Under: Home Prices, Homes for Sale, Short Sales and Foreclosures, Torrance CA real estate market, Torrance Real Estate, Torrance real estate trends Tagged With: median home prices in torrance, torrance homes for sale, torrance real estate

July 2014 Median Home Prices in Torrance CA

September 8, 2014 by Keith Kyle

By Keith KyleWelcome home doorway

July 2014 saw some big numbers in terms of both number of homes sold as well as median prices.  Torrance CA  had 142 sold homes at a median price of $540,000 which was down from the same month in 2013.  Most other South Bay cities also saw some significant year over year increases in prices with the other exceptions being  Marina Del Rey and Playa Del Rey.  To see the actual homes sales in each city visit our recent home sales price and information site.

City Homes Sold July 2014 Median July 2013 Median Year over Year % Change
Carson 48 $382,500 $350,000 9.29%
El Segundo homes 15 $872,000 $797,000 9.41%
Gardena 50 $385,000 $332,500 15.79%
HarborCity 13 $480,000 $465,000 3.23%
Hawthorne real estate 51 $505,000 $400,000 26.25%
Hermosa Beach homes 26 $1,230,000 $1,097,500 12.07%
Lawndale 8 $412,000 $331,250 24.38%
Lomita 13 $555,000 $452,000 22.79%
Long Beach 330 $400,000 $365,000 9.59%
Manhattan Beach homes 43 $1,795,000 $1,521,250 18.00%
Marina Del Rey 33 $757,500 $862,500 -12.17%
Palos Verdes Estates 51 $1,600,000 $1,291,000 23.93%
Playa Del Rey 23 $507,000 $512,000 -0.98%
RanchoPalos Verdes 54 $1,069,000 $1,100,000 -2.82%
Redondo Beach homes 97 $865,000 $758,000 14.12%
San Pedro 49 $440,000 $420,500 4.64%
Torrance 142 $540,000 $576,250 -6.29%
Westchester 48 $777,500 $715,000 8.74%

Filed Under: Home Prices, Torrance CA real estate market, Torrance Real Estate, Torrance real estate trends Tagged With: homes for sale, median home prices, number of sold homes, prices, real estate, torrance, torrance ca

Real Estate Micro Market Update – Southwood Torrance

June 17, 2014 by Keith Kyle

Southwood Torrance Real Estate Update

By Keith Kyle

The neighborhood of Southwood in Torrance CA is a fantastic area with tree lined streets with primarily single family homes and a great community feel. Prices in this neighborhood, located just east of Redondo Beach, have seen steady increases since the beginning of 2013 and doesn’t show any signs of slowing down. Here’s a quick recap of the current real estate market conditions in this Torrance neighborhood.

  • Active Southwood Torrance homes for sale – 8
  • Lowest list price – $485,000 – 5500 Torrance Blvd #C121
  • Highest list price – $1,199,000 – 21213 Anza Ave
  • Average list price – $753,713
  • Average price per square foot – $483.68
  • Average Days on Market – 35
  • In escrow – 8
  • Total homes sold in 2014 YTD – 20
  • Average sales price – $627,688
  • Average price per square foot – $474.73

Filed Under: Homes for Sale, Southwood, Torrance Real Estate, Torrance real estate trends, Torrance Realtors, West Torrance homes 90503 Tagged With: 90503, homes for sale, market trends, real estate, southwood, torrance

Welcome to Torrance Real Estate and Homes for Sale

April 17, 2014 by Keith Kyle

By Keith KyleWelcome to Torrance real estate

Welcome to Torrance real estate.  We have strived to offer the very best information and home search features on a local website designed specifically for Torrance home buyers and sellers.  As local Torrance and Redondo Beach real estate specialists we understand how unique Torrance is and how different and distinct the various areas can be.  From oceanfront homes in the Hollywood Riviera, to duplex and income properties in the County Strip area…..we can help.  Search for homes with our free Torrance MLS access or allow us to do the hard work for you with our FREE daily listing updates and know about new homes first.  Our website offers information on real estate markets and trends in each neighborhood, recent home sales and prices, current off market homes and MLS listings, short sales and foreclosures and information for home sellers to find out what their Torrance home is worth and how we have been so successful at marketing and selling homes in the area.  We hope that our website is a great place to start for all of your Torrance real estate needs.  Contact us as any time for questions or more information.

torrance homes for sale
west torrance homes
southwood torrance
Search all Torrance Homes
West Torrance 90503
Southwood 90503
hollywood riviera homes
Central Torrance homes for sale
south torrance real estate
Hollywood Riviera 90277
Central Torrance 90503
South Torrance 90505
walteria torrance homes
north Torrance homes for sale
old torrance homes
Walteria & Victoria Knolls 90505
North Torrance 90504
Old Torrance 90501
south east torrance homes
harbor gateway torrance homes
Plaza Del Amo real estate
South East Torrance 90501 & 90505
Harbor Gateway & County Gateway
Plaza Del Amo
south east torrance homes
Single family homes for sale in Torrance
condos and townhomes for sale in Torrance
Seaside Ranchos South Torrance
Single Family Homes
Condos and Townhomes
Torrance duplexes for sale
55+ senior condos in Torrance
Torrance real estate map
Multi-Unit Investment – Duplexes
55+ Senior Condos and homes
Torrance Real Estate Map

Current homes for sale in Torrance California


Click any MLS number above for details and photos of the home.

Filed Under: Buyers, Central Torrance 90503, County Strip, County Strip and Harbor Gateway, First Time Buyers, Hollywood Riviera homes 90277, Homes for Sale, Listing Agents, Luxury Homes, North Torrance West, Old Torrance, Plaza Del Amo, Pocket Listings, Seaside Ranchos, Sellers, Short Sales and Foreclosures, South Torrance, Southwood, Torrance CA real estate market, Torrance Real Estate, Torrance real estate trends, Torrance Realtors, Victoria Knolls, Walteria, West Torrance homes 90503 Tagged With: hollywood riviera, home prices, home search, home values, homes for sale, mls search, new listings, real estate, search for homes, torrance, torrance realtors

North Torrance West Real Estate Statistics

March 4, 2014 by Keith Kyle

By Keith Kyle

As knowledge is critical in real estate, we hope that the information provided below will make the real estate market in the North West areas of Torrance easier to understand and the trends can make for educated decisions. Whether you are a buyer, or a seller, knowing what the market is doing and where it appears to be heading can make all of the difference in the world. If we can be of assistance in any way please don’t hesitate to contact us. You can view these trends for all Torrance CA neighborhoods.

View the current North Torrance – West Homes for Sale

The chart below shows the recent history of the number of active listings, pending home sales and closed escrows. The higher ratio of active to sold/pending listings shows a buyers market while lower inventory shows a sellers market.

The chart below shows the average price per square foot in North Torrance West. This includes all types of homes including condos, townhomes and single family homes

The chart below shows the percentage of sold price / list price at which an equal number of properties are sold above, equal or below the list price and it indicates how long it has taken to sell those properties.

The chart below shows the difference between the average price for sale in North Torrance and average price of the sold homes. It helps determine whether the market is a buyer or seller market. If the average listing price and average sold price are the closest, the area has the healthiest market.

The chart below shows the months of inventory for a particular month. As a rule of thumb, an inventory level of less than three indicates a strong seller market while an inventory level greater than six indicates a buyer’s market.


CURRENT NORTH TORRANCE WEST HOMES FOR SALE
[idx-listings community=”132 – N Torrance – West” statuses=”1″ orderby=”DateAdded” orderdir=”DESC” count=”25″ showlargerphotos=”true” listtabalignment=”Left”]

Filed Under: Buyers, North Torrance West, Torrance CA real estate market, Torrance Real Estate, Torrance real estate trends Tagged With: active home listings, days on market, market statistics, market trends, north torrance, pending sales, prices, real estate, sold homes

  • « Previous Page
  • 1
  • …
  • 21
  • 22
  • 23
  • 24
  • 25
  • Next Page »
  • FREE Listing Updates
  • What’s Your Home Worth?
  • Search Torrance CA Homes For Sale and Current Listings