Welcome to our Torrance real estate update for the coming year. 2020 is looking to be another banner year for home sellers as the  combination of seemingly endless demand and historically low interest rates means more people will be looking to purchase a home.
View the current homes for sale in Torrance California.
In general the real estate market seems to be slowing down heading into 2020 but for a very odd reason…..each month there are fewer homes hitting the market. Fewer listings mean fewer home sales. January saw a very slight uptick in the number of listings so we’re hopeful that is a trend that continues. Other than that small bump in January, the number of homes for sale has dropped every month since May of 2019
According to Torrance realtor Keith Kyle, “It’s clear that the market is cooling off as there has been an increase in new listings coupled with fewer sales and homes going into escrow since summer.” The chart above shows that the number of active listings has held pretty steady between 150 and 170 since summer, but the number of sold homes as well as new escrows has continued to decrease. If this trend continues the market will shift more in favor of buyers and less in favor of sellers. It’s clearly been a sellers market over the past few years.
The chart below shows the upward trend over the past few months with avarage “months of inventory” of unsold homes on the rise.
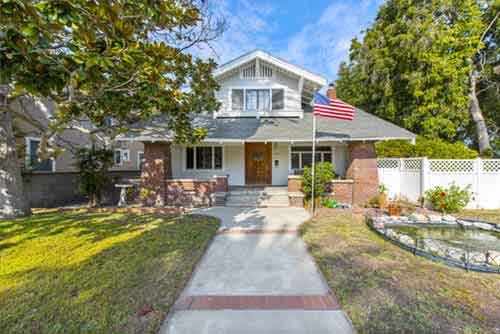 neighborhoods and communities. Prices range dramatically so it’s great to focus stats and trends on small parts of town as well as Torrance real estate in general. 2019 saw 96 “on market” home sales in the community of Old Town Torrance. This neighborhood has a charming historic feel unlike anything else in the South Bay. The median “list” price was $690,000 with the median home sale priced at $689,500 meaning that homes basically sold for full price during the year. This continued the trend of being a very solid “seller’s market”. Homes were on the market an average of 34 days before selling or going into escrow. The lowest price of the year was $255,000 for a one bedroom condo on Cabrillo with the highest priced sale of the year being $1,130,000 for a two unit property on Arlington. The majority of the home sales were single family homes and several were beautiful historic craftsman homes which is what makes this neighborhood in Torrance so special.
 single family homes. The median list price for the closed sales was $1,200,000 with the median sales price of $1,177,500 indicating that it is still a solid seller’s market. That does seem to be shifting somewhat with the playing field leveling just a bit. The least expensive home sale during October was $820,000 for a 3 bedroom, 2 1/2 bath single family home at 4414 Highgrove and the most expenseive sale of the month was a Louis Tomaro designed home at