Top Home Sale of the Month – 4222 Paseo De Las Tortugas at $2,095,000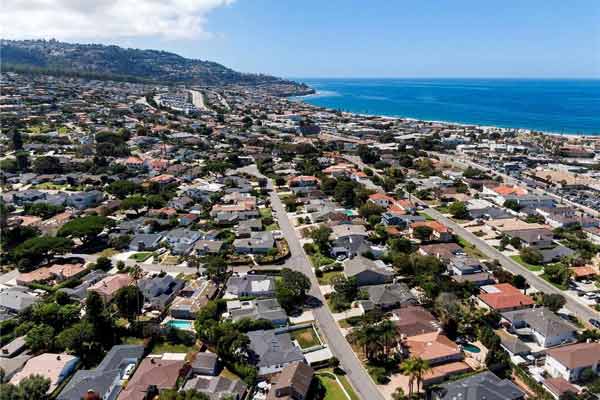
The highest price home sale of the month in Torrance was a spacious single family residence in the Hollywood Riviera with a bonus studio (supposedly built originally for a famous bank to rehearse and record). The home offered 4 bedrooms and 2 and 1/2 baths. It was spacious but definitely dated and needing a lot of work to make it a higher end property. The home was listed for $2,195,000 and closed escrow at $2,095,000.
View the MLS listing details below.
Property Info
- 4 bedrooms
- 2.5 bathrooms
- 3,450 square feet
- Verty large 11,000+ foot lot
- Built in 1991
- Sold at $2,095,000
4222 Paseo De Las Tortugas, Torrance – Listed for $2,195,000 and sold at $2,095,000
Listing courtesy of Roger Hart -Forecast Realty Inc. 310-781-2000
 November 2021 saw an impressive 104 on market home, condo and townhome sales closing during the month. The average “list” price of the homes that closed escrow during the month was $907,023 with the average “sold” price at $940,974 meaning that homes generally sold well above the asking price. Homes averaged a very short 18 days on the market before going into escrow with a median DOM of only 9 days. Median price per foot was $647.
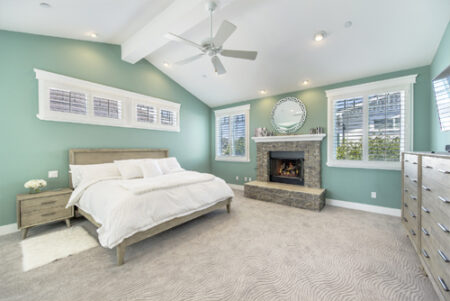
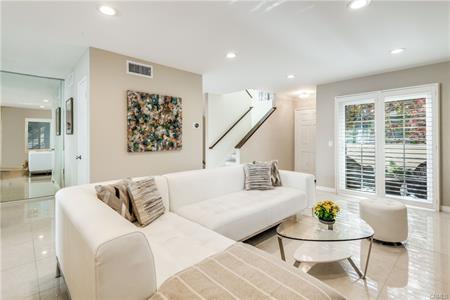 Summerwind complex. The home has been extensively updated with a very different look and feel then what we are accustomed to. It has a modern beach feel with muted colors and clean lines. The home is priced at $799,000.