• Home
  • FREE Email Listing Updates
  • Search for Homes
    • Search The MLS
    • Search By Map
    • Search by Zip Code
    • 55+ Senior Communities
    • Open Houses in Torrance
    • South Bay homes & real estate
  • Search by Neighborhood
    • All Torrance Listings
    • Old Torrance – 90501
    • West Torrance – 90503
    • South Torrance – 90505
    • Southwood – 90503
    • Central Torrance – 90503
    • Southeast Torrance – 90501 & 90505
    • North Torrance – 90504
    • Walteria and Victoria Knolls – 90505
    • Hollywood Riviera – 90277
    • Plaza Del Amo
    • Harbor Strip & Gateway – 90501
  • Search by Price
    • Below $450,000
    • $450,000 – $600,000
    • $600,000 – $750,000
    • $750,000-$900,000
    • $900,000-$1,100,000
    • $1,100,000-$1,250,000
    • $1,250,000-$1,500,000
    • Above $1,500,000
  • Sellers
    • What is my Home Worth?
    • How We Sell
    • Quick Home Valuation
    • Recent Torrance Property Prices
    • Quick Valuation
  • Market News
  • About
    • Neighborhoods
      • Torrance Schools
      • Neighborhood Map
      • West Torrance
      • Southwood
      • Hollywood Riviera
      • Walteria & Victoria Knolls
      • South Torrance
      • Old Torrance
      • North Torrance
      • Plaza Del Amo
      • Central Torrance
      • 55+ Senior Communities
      • South Bay and Palos Verdes
    • Your Torrance Realtor
      • Client Testimonials
      • Vista Sotheby’s
      • Contact Us – Torrance Realtor Keith Kyle of Vista Sotheby’s
      • Search for Homes by Torrance Neighborhood or Community Map
      • The Cities in the South Bay
      • Our Google+ Profile
      • Home Selling Process
    • Torrance Schools
    • Recent home sales and escrows
    • Market Trends
      • Hollywood Riviera
      • West Torrance
      • Walteria
      • Old Torrance
      • North Torrance West

Torrance real estate and homes for sale

Search for homes in Torrance CA

Slow Month for Torrance Home Sales – 46 Closed Sales in January

February 15, 2023 by Keith Kyle

Torrance Real Estate Update for January 2023

The real estate market in Torrance really slowed in November in terms of the number of homes that sold but home prices continued to impress.  There were only 46 homes that closed escrow during the month which was the slowest we’ve seen in some time.    Compared with the peak summer month of 112 homes that sold in July and you can see how slow the market was.

The average “list” price  was a very impressive $1,060,928 with the average sold price at $1,046,500 meaning that homes generally sold below the asking price.

The average price per foot for the month was $648 which was slightly lower than in October. The average days on market was a 42 before going into pending status.

See how that compares with other months on our Torrance real estate trends and statistics page.

Search the current homes for sale in Torrance

January 2023 Torrance Home Sales and Prices

Type Address Price $ Per Sq Ft Bed/Bath Sq Feet Age
CONDO/A 22959 Nadine Cir #A $556,000 $585 2/1,0,1,0 950/A 1963
SFR/D 21121 Broadwell AVE $730,000 $473 3/2,0,0,0 1544/A 1954/PUB
SFR 1418 W 216TH ST $750,000 $437 5/3,0,0,0 1717/ 1942
CONDO/A 21852 S Vermont AVE #6 $535,000 $578 2/2,0,0,0 926/A 1994/ASR
SFR/D 22925 Berendo AVE $834,500 $713 3/2,0,0,0 1171/A 1951/ASR
SFR/D 23224 Broadwell AVE $908,000 $422 4/2,0,0,0 2150/A 1962/ASR
SFR/D 3104 Dalemead ST $1,375,000 $603 4/1,2,0,0 2280/A 1950/ASR
SFR/D 2503 Dalemead ST $1,520,000 $789 3/1,1,0,0 1926/A 1955/ASR
CONDO/A 2800 Plaza Del Amo #303 $725,000 $612 2/2,0,1,0 1185/A 1989/ASR
TWNHS/A 2801 Sepulveda BLVD #123 $949,000 $502 3/3,0,0,0 1889/A 1996/ASR
SFR/A 805 Cerise AVE $1,010,000 $556 4/2,0,0,0 1816/A 1951/ASR
SFR 20318 Perkins AVE $1,030,000 $584 3/2,0,0,0 1764/A 1969/ASR
SFR/D 2111 Shelburne WAY $1,215,000 $502 4/3,0,0,0 2420/A 1987/ASR
SFR/D 2889 Plaza Del Amo #200 $1,225,000 $536 3/2,0,1,0 2285/A 2002/ASR
CONDO/A 22943 Maple AVE #A $575,000 $515 2/0,2,0,0 1117/A 1963/ASR
SFR/D 3614 W 225th ST $1,175,000 $936 3/1,1,0,0 1255/A 1956/ASR
SFR/D 2550 W 234th ST $1,360,000 $661 4/1,1,0,0 2058/P 1964/ASR
SFR/D 5009 Zakon RD $1,187,663 $723 3/1,1,1,0 1643/A 1956/ASR
SFR/D 22319 Kathryn AVE $1,200,000 $1,111 3/1,0,0,0 1080/A 1953/ASR
SFR/D 22904 Evalyn Ave $1,225,000 $817 3/1,1,0,0 1500/A 1954/ASR
SFR/D 23317 Carlow RD $1,371,910 $792 3/2,0,0,0 1732/A 1960/PUB
SFR/D 23505 Ladeene AVE $1,555,000 $634 4/1,2,0,0 2452/O 1962/ASR
SFR/D 21513 Ellinwood DR $1,280,000 $791 4/1,1,0,0 1619/A 1955/ASR
SFR/D 20614 Mansel AVE $1,100,000 $742 3/2,0,0,0 1482/A 1958/ASR
SFR/D 4540 Cadison ST $1,125,000 $683 3/1,1,0,0 1646/A 1954/ASR
SFR/D 19413 Sturgess DR $1,252,000 $1,084 3/2,0,0,0 1155/A 1956/ASR
SFR 19301 Donora AVE $1,255,000 $1,002 3/2,0,0,0 1252/AP 1955/ASR
SFR/D 19521 Flavian AVE $1,300,000 $744 3/1,1,0,0 1748/A 1955/PUB
SFR/D 17114 Elgar AVE $852,000 $531 2/2,0,0,0 1606/A 1948/ASR
SFR/D 3722 W 181st ST $950,000 $569 3/2,0,0,0 1670/S 1953/ASR
SFR 18002 Bailey DR $968,000 $740 4/2,0,0,0 1309/A 1955/ASR
SFR/D 4118 W 178th Street $992,000 $718 4/2,0,0,0 1381/P 1955/PUB
SFR/D 17025 Cerise AVE $1,043,000 $462 3/1,1,1,0 2257/A 1964/ASR
SFR/D 18923 Yukon AVE $1,050,000 $551 4/2,0,1,0 1904/A 1953/ASR
SFR/D 16720 Falda AVE $1,060,000 $708 3/2,0,1,0 1498/A 1952/ASR
SFR 16911 Purche AVE $665,000 $535 3/1,1,0,0 1244/ 1956
SFR/D 2204 W 161st ST $750,000 $484 4/2,0,0,0 1549/A 1956/PUB
SFR/D 2137 W 183rd ST $915,000 $436 5/3,0,0,0 2100/A 1962/PUB
SFR/D 2010 W 177th ST $983,000 $759 3/2,0,0,0 1295/A 1953/ASR
CONDO/A 2700 Arlington Ave #106 $710,000 $563 2/2,0,0,0 1262/A 1982/ASR
TWNHS 1747 Arlington AVE $949,000 $573 3/2,0,1,0 1655/ 1990
SFR/D 2268 Sonoma ST $1,150,000 $690 3/1,1,0,0 1666/A 1927/ASR
SFR/D 2444 W 230th ST $990,000 $557 3/2,0,0,0 1776/A 1963/ASR
SFR/D 2378 W 234th Street $1,165,000 $619 3/2,1,0,0 1883/P 1960/PUB
SFR/D 2403 W 232nd St. $1,175,000 $666 3/2,0,0,0 1763/A 1962/ASR
SFR/D 2320 W 235th ST $1,199,000 $540 5/3,0,0,0 2220/A 1963/ASR

Any information relating to a property referenced on this web site comes from CRMLS. This web site may reference real estate listing(s) held by a brokerage firm other than the broker and/or agent who owns this website. The accuracy of all information is deemed reliable but not guaranteed and should be personally verified through personal inspection by and/or with the appropriate professionals.
Filed Under: Torrance CA real estate market, Torrance home prices, Torrance homes for sale, Torrance Real Estate, Torrance real estate trends Tagged With: torrance home prices, torrance home sales, torrance real estate

2022 Torrance Real Estate Market Recap – By the Numbers

January 22, 2023 by Keith Kyle

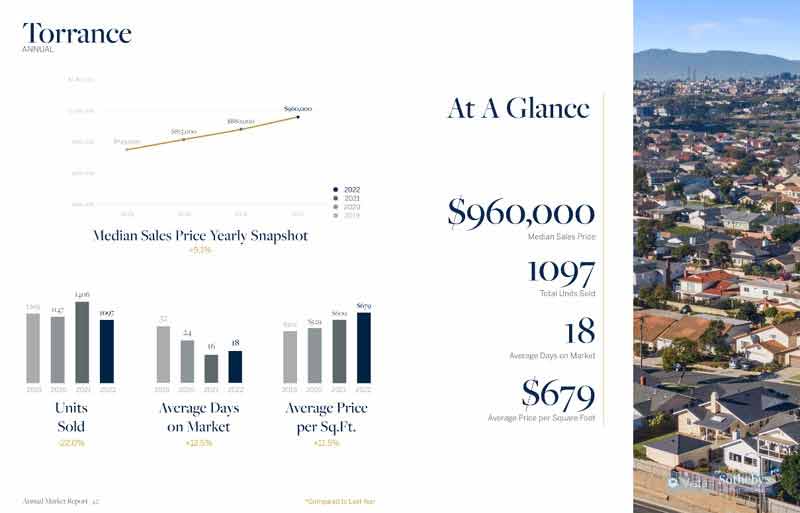
What a year it was for home sales and home prices in Torrance CA.    There were 1,097 condos, townhomes and homes sold during 2022.

The median sales price was an impressive $960,000 and average price per square foot was $679.

Homes averaged only 18 days on market before going into escrow.  View the current Torrance homes for sale.

Torrance 2022 Real Estate Market at a Glance

Filed Under: Torrance CA real estate market, Torrance home prices, Torrance homes for sale, Torrance Real Estate, Torrance real estate trends Tagged With: current homes for sale in torrance, torrance home prices, torrance home sales, torrance homes for sale, torrance real estate 2022, torrance real estate market

See All of the Torrance Home Sales in December

January 16, 2023 by Keith Kyle

Torrance Real Estate Update for December 2022

The real estate market in Torrance really slowed in November in terms of the number of homes that sold but home prices continued to impress.  There were only 61 homes that closed escrow during the month which was down from 76 in October and 86 sales in September.  Compared with the peak summer month of 112 homes that sold in July and you can see how slow the market was.

The average “list” price  was a very impressive $995,705 with the average sold price at $966,517 which was down a bit from October’s average price of $1,045,073.

The average price per foot for the month was $632 which was slightly lower than in October. The average days on market was 50 before going into pending status. This was considerably higher than the 32 days on market in November.

See how that compares with other months on our Torrance real estate trends and statistics page.

Search the current homes for sale in Torrance

December 2022 Torrance Home Sales and Prices

Home Type Address Price $ Per foot Bed/Bath Sq Feet Age
CONDO/A 22925 S Van Deene AVE $459,900 $413 3/2,0,0,0 1113/A 1973/ASR
SFR/D 21322 S Western AVE $597,000 $750 2/1,0,0,0 796/SEE 1925/ASR
SFR/D 20840 Denker AVE $675,000 $674 2/1,0,0,0 1001/A 1949/PUB
DPLX/A 1625 W 226th ST $735,000 $459 4/2,0,0,0 1600/A 1960/ASR
SFR 1620 W 221st ST $820,000 $691 4/2,0,0,0 1187/ 1949
SFR/D 1321 W 221st ST $830,000 $536 2/1,1,0,0 1548/A 1947/PUB
CONDO/A 812 Coriander DR #Q $360,000 $563 1/1,0,0,0 639/A 1973/PUB
CONDO/A 1101 Sepulveda BLVD #A202 $445,000 $559 2/1,0,0,0 796/A 1973/ASR
CONDO/A 20506 S Vermont AVE #64 $495,000 $511 2/2,0,0,0 969/A 1978/ASR
CONDO/A 23308 Sesame ST #C $507,000 $612 2/2,0,0,0 829/A 1973/ASR
CONDO/A 21415 S Vermont AVE #49 $510,000 $563 2/2,0,0,0 906/A 1990/PUB
SFR 22925 Alexandria AVE $530,000 $611 3/1,0,0,0 867/ 1955
SFR/D 1254 W 212th ST $699,000 $799 2/1,0,0,0 875/A 1954/ASR
SFR/D 946 W 214th ST $740,000 $556 3/1,1,0,0 1332/A 1960/ASR
SFR/D 962 Oasis DR $760,000 $594 3/2,0,0,0 1280/A 1962/ASR
SFR/D 1204 Valle CT $870,000 $460 3/2,0,1,0 1891/A 2005/ASR
TWNHS/A 24444 Hawthorne BLVD #105 $775,000 $647 2/1,1,1,0 1197/A 2017/ASR
SFR/D 2722 Grand Summit RD $1,070,000 $663 3/1,1,0,0 1614/S 1954/ASR
SFR/D 2522 Highcliff DR $1,149,000 $946 3/1,1,0,0 1214/A 1955/ASR
TWNHS/D 3925 Newton ST $1,330,000 $493 4/5,0,0,0 2700/A 2006/ASR
CONDO/A 3550 Torrance BLVD #316 $340,000 $694 0/1,0,0,0 490/A 2006/ASR
CONDO/A 2605 Sepulveda BLVD #228 $520,000 $524 1/1,0,1,0 993/A 2003/ASR
CONDO/A 2605 Sepulveda Blvd. #129 $675,000 $557 2/0,2,0,0 1212/A 2003/ASR
CONDO/A 2800 Plaza Del Amo #392 $760,000 $597 2/3,0,0,0 1273/A 1988/ASR
CONDO/A 2563 Plaza Del Amo #402 $805,000 $618 2/2,0,0,0 1303/A 1985/ASR
SFR/D 1122 Hickory AVE $825,000 $505 3/1,1,0,0 1635/A 1951/PUB
TWNHS/A 2615 Plaza Del Amo #644 $850,000 $557 3/2,0,1,0 1526/A 1987/ASR
SFR/D 2925 W Carson ST #1 $1,050,000 $519 4/3,0,0,0 2023/A 2000/ASR
SFR/D 2889 Plaza Del Amo #131 $1,335,000 $476 4/3,0,0,0 2806/A 2002/ASR
SFR/D 1323 Cranbrook AVE $1,349,888 $482 4/3,0,0,0 2803/A 1990/ASR
CONDO/A 22644 Nadine CIR #A $515,000 $461 2/2,0,0,0 1117/A 1963/ASR
SFR/D 22714 Fonthill AVE $1,232,000 $516 5/3,0,0,0 2388/A 1963/ASR
SFR/D 2513 Date CIR $1,260,000 $501 4/3,0,0,0 2517/A 1964/ASR
SFR/D 2521 Date CIR $1,375,000 $543 5/3,0,0,0 2534/A 1964/ASR
SFR/D 3826 Newton ST $1,220,000 $1,003 3/2,0,0,0 1216/A 1960/ASR
SFR/D 4827 Greenmeadows AVE $1,315,000 $662 3/2,0,0,0 1987/A 1953/ASR
SFR 4246 Mesa ST $1,540,000 $623 4/2,2,0,0 2470/A 1979/ASR
SFR/D 4921 Calle De Arboles $1,999,999 $1,027 4/2,0,1,0 1947/A 1956/ASR
SFR/D 5608 Palos Verdes BLVD $830,000 $957 3/1,0,0,0 867/A 1952/ASR
SFR/D 23236 Ladeene $1,050,000 $511 4/2,0,0,0 2056/E 1961/ASR
SFR/D 5427 Reese Rd $2,500,000 $547 4/4,0,0,0 4567/A 1947/ASR
CONDO/A 21345 Hawthorne BLVD #126 $659,000 $724 2/2,0,0,0 910/A 2005/PUB
SFR/D 22121 Palos Verdes Blvd. $1,160,000 $1,018 3/1,1,0,0 1140/A 1955/ASR
SFR/D 20011 Hawthorne BLVD $912,000 $815 3/1,0,0,0 1119/A 1954/ASR
CONDO/A 4489 Spencer ST #330 $980,000 $524 3/2,0,1,0 1871/A 1999/ASR
SFR/D 5520 Halison ST $1,075,000 $926 3/2,0,0,0 1161/A 1956/SEE
SFR/D 5325 Carmelynn ST $1,120,000 $684 3/1,1,0,0 1638/A 1956/ASR
SFR/D 21018 Annrita AVE $1,175,000 $842 4/2,0,0,0 1396/A 1959/ASR
SFR/D 5012 Garnet ST $1,200,000 $797 3/1,1,0,0 1506/A 1961/ASR
SFR/D 19321 Anza Avenue $1,220,000 $897 3/1,1,0,0 1360/A 1954/ASR
SFR/D 4918 Garnet ST $1,550,000 $642 4/3,0,0,0 2415/A 1965/ASR
SFR/D 17508 Elgar AVE $760,000 $764 2/1,0,0,0 995/A 1951/ASR
SFR 18333 Falda AVE $800,000 $650 3/1,0,0,0 1231/A 1953/ASR
SFR/D 3324 W 188th ST $830,000 $665 4/2,0,0,0 1249/P 1950
SFR/D 3201 W 181st ST $933,000 $762 3/1,1,0,0 1225/A 1955/ASR
SFR/D 4171 W 172nd ST $934,500 $680 3/2,0,0,0 1375/A 1951/ASR
SFR/D 18807 Kornblum AVE $1,035,000 $570 4/3,0,0,0 1817/A 1954/PUB
SFR/D 3227 W 188th ST $1,035,000 $558 4/1,2,0,0 1854/A 1950/ASR
SFR/D 18300 Mansel AVE $1,280,000 $556 3/1,2,0,0 2304/A 1976/ASR
SFR/D 2117 W 178th ST $800,000 $746 3/1,0,0,0 1073/A 1953/PUB
SFR/D 2204 W 165th ST $825,000 $549 3/2,0,0,0 1504/A 1954/ASR
SFR/D 2322 Descanso WAY $925,000 $466 4/1,1,0,0 1986/A 1979/ASR
SFR/D 2321 W 180th ST $935,000 $685 3/2,0,0,0 1364/A 1956/ASR
SFR/D 16403 Wilton PL $945,000 $635 3/2,0,0,0 1488/A 1949/ASR
SFR/D 2021 W 182nd ST $1,200,000 $246 4/3,1,0,0 4887/A 1968/APP
CONDO/A 2336 Andreo AVE $735,000 $632 2/2,0,1,0 1163/A 2007/ASR
SFR/D 1635 Post AVE $750,000 $478 2/1,0,0,0 1568/A 1927/ASR
DPLX/D 2020 Andreo AVE $900,000 $528 5/3,0,0,0 1706/P 1922/PUB
SFR/D 1318 Beech Ave $1,175,000 $803 3/1,0,1,0 1464/A 1937/ASR
SFR/D 2269 Sepulveda WAY $1,390,000 $699 4/2,0,0,0 1989/A 1977/ASR
SFR/D 23721 Cypress ST $1,100,000 $609 3/3,0,0,0 1805/A 1957/ASR
SFR/D 2338 W 235th PL $1,120,000 $491 3/3,0,0,0 2280/A 1963/PUB
SFR/D 2016 W 233rd ST $1,170,000 $683 3/2,0,0,0 1713/A 1968/ASR
SFR/D 1921 W 236 ST $1,190,000 $506 4/2,0,1,0 2350/A 1973/ASR

Any information relating to a property referenced on this web site comes from CRMLS. This web site may reference real estate listing(s) held by a brokerage firm other than the broker and/or agent who owns this website. The accuracy of all information is deemed reliable but not guaranteed and should be personally verified through personal inspection by and/or with the appropriate professionals.
Filed Under: Home Prices, Torrance home prices, Torrance Real Estate, Torrance Realtors Tagged With: december home sales in torrance, torrance home prices, torrance home sales, torrance real estate, torrance real estate market

2022 Torrance Real Estate Recap – By the Numbers

January 16, 2023 by Keith Kyle

Let’s take a quick look at the Torrance real estate market in 2022 and how each month fared. Belmar homes

There were 1,103 homes, condos and townhomes  in Torrance sold during 2022 with an average “list” price of $997,659 and an average sold price of $1,029,793. The median listing price was $949,888 and the median sold price was $960,000. Homes averaged only 18 days on the market before going into escrow. The median days on market was an incredibly low 9 before going into escrow.

As is the norm the summer months were the busiest with the market much slower from December through April.

If you’re looking towards the future and not the past, search the current homes for sale in Torrance CA.

Date Jan Feb March April May June July August Sept Oct Nov Dec
For Sale 47 52 76 67 101 150 135 137 126 139 113 91
Sold 76 71 107 129 109 111 111 87 84 77 61 74
Avg. List Price $928K $1,018M $1,112M $1,153M $1,246M $1,119M $1,159M $1,139M $ 1,165M $1,083M $1,032M $1,018M
Avg. Sold Price $963K $ 968K $1.056M $1,048M $ 1,111M $1,063M $1,027M $1,047M $1,004M $1,043M $ 976K $ 967K
Avg. Sq. Ft. Price (Sold) 641 700 667 701 753 710 689 668 673 671 616 601
Avg Days on Market 20 14 10 12 11 9 15 17 24 27 28 43


Filed Under: Buyers, Homes for Sale, Torrance CA real estate market, Torrance home prices, Torrance homes for sale, Torrance Real Estate, Torrance real estate trends, Torrance Realtors Tagged With: real estate in torrance ca, torrance home sales, torrance real estate, torrance real estate market

Torrance Home Sales And Prices in September 2022

October 10, 2022 by Keith Kyle

Real Estate Recap – Home Sales and Home Prices for September

September real estate was a slower month for both the number of homes that sold and the prices that they sold for.  There were 86 homes that closed escrow during the month which was only slightly lower than August but really down from the 112 homes that sold in July.

The average “list” price for the homes that sold during September was a very impressive $1,006,455 with the average sold price at $1,005,076 meaning that homes generally slightly below full price for the 2nd month in a row.

The average price per foot for the month was $688. The average days on market was a short 25 before going into pending status compared with 19 in the prior month.  See how that compares with other months on our Torrance real estate trends and statistics page.

Search the current homes for sale in Torrance

September 2022 Torrance Home Sales and Prices

Type Address Price $ Per foot Bed/Bath Sq Feet Year
SFR/D 16711 Patronella $1,025,000 $693 3/2,0,0,0 1480/A 1952
SFR/D 1520 W 221st ST $700,000 $1,178 1/1,0,0,0 594/A 1948/ASR
SFR/D 1524 W 221st ST $700,000 $738 3/1,0,0,0 948/A 1953/ASR
SFR/D 20917 Dalton AVE $775,000 $658 3/1,0,0,0 1178/A 1947/ASR
SFR/D 20913 Brighton AVE $825,000 $671 3/1,0,0,0 1230/A 1951/ASR
SFR/D 21136 Harvard BLVD $920,000 $559 3/2,0,0,0 1647/A 1953/ASR
SFR/D 20812 Brighton AVE $954,000 $698 3/2,0,0,0 1367/A 1955/ASR
SFR/D 1630 W 215th ST $960,000 $454 3/3,0,0,0 2116/A 1947/ASR
CONDO/A 816 Coriander DR #A $271,000 $653 0/1,0,0,0 415/A 1973/PUB
CONDO/A 20614 S Vermont #34 $422,000 $643 1/1,0,0,0 656/A 1978/ASR
TWNHS/A 22533 S Vermont AVE #66 $570,000 $576 3/2,0,0,0 989/A 1980/ASR
SFR/D 20804 Doble AVE $725,000 $620 3/2,0,0,0 1169/A 1960/ASR
SFR 1128 W 210th ST $752,000 $758 3/2,0,0,0 992/ 1953
SFR/D 1042 Clarion DR $770,000 $550 3/1,1,0,0 1401/A 1959/ASR
SFR/D 20635 Mariposa AVE $900,000 $578 4/2,0,0,0 1558/A 1960/ASR
SFR/D 2702 Ridgeland RD $1,295,000 $834 3/2,0,0,0 1552/A 1954/ASR
SFR/D 2832 Danaha ST $1,325,000 $887 3/2,0,0,0 1493/A 1953/ASR
SFR/D 25610 Fallenleaf DR $1,468,000 $718 3/3,0,0,0 2045/A 1976/ASR
SFR/D 3002 Windmill RD $1,600,000 $823 3/3,0,0,0 1945/A 1975/ASR
CONDO/A 2571 Plaza Del Amo #203 $590,000 $678 1/2,0,0,0 870/A 1985/ASR
COOP/A 3210 Merrill DR #39 $595,000 $441 3/2,0,0,0 1350/E 1963/ASR
TWNHS/A 2800 Plaza Del Amo #483 $747,000 $687 2/2,0,1,0 1088/A 1987/ASR
SFR/D 2785 Maricopa ST $1,275,000 $508 4/2,0,1,0 2512/P 2005/PUB
SFR/D 3309 Antonio ST $1,385,000 $762 3/2,1,0,0 1818/A 1955/ASR
CONDO/A 23003 A Maple AVE #A $580,000 $519 2/2,0,0,0 1117/A 1963/ASR
CONDO/A 22709 Nadine CIR #B $580,000 $519 3/2,0,0,0 1117/A 1963/ASR
CONDO/A 22719 Nadine CIR $764,000 $674 2/2,0,0,0 1133/A 1963/ASR
SFR/A 2525 W 233rd ST $1,233,000 $547 4/2,0,0,0 2256/A 1965/PUB
SFR/D 4319 Newton ST $1,150,000 $849 2/1,0,1,0 1354/SEE 1954/ASR
SFR/D 4602 Highgrove AVE $1,660,000 $970 3/2,0,1,0 1711/A 1953/ASR
SFR/D 4704 Paseo De Las Tortugas $1,800,000 $1,012 3/2,0,0,0 1778/A 1956/ASR
SFR/D 5507 Calle Mayor $1,835,000 $793 5/3,0,0,0 2313/AP 1954/ASR
SFR/D 4505 Paseo De Las Tortugas $2,186,860 $862 3/2,0,0,0 2536/A 1956/ASR
TWNHS/A 4036 W 226th ST $780,000 $463 2/2,0,1,0 1685/A 1981/PUB
SFR/D 22738 Anza AVE $1,063,000 $936 3/1,1,0,0 1136/A 1953/ASR
SFR/D 22414 Shadycroft AVE $1,087,000 $1,264 2/1,0,0,0 860/A 1952/PUB
SFR/D 23327 Anza AVE $1,100,000 $726 3/2,0,0,0 1516/A 1960/ASR
SFR/D 5249 Vanderhill RD $1,100,000 $882 3/1,1,0,0 1247/A 1949/ASR
SFR/D 4320 W 238th ST $1,300,000 $627 4/1,1,0,0 2074/A 1962/ASR
SFR/D 3854 Tiffany LN $1,705,000 $588 3/3,0,0,0 2899/A 1977/ASR
SFR/D 4014 Torrance BLVD $1,188,000 $522 5/4,0,0,0 2277/A 1956/PUB
SFR/D 21710 Marjorie AVE $1,275,000 $848 3/1,1,0,0 1504/A 1956/ASR
CONDO/A 3540 Emerald $624,000 $788 2/1,0,0,0 792/A 1987/ASR
SFR/D 19433 Anza AVE $1,040,825 $929 3/1,0,0,0 1120/A 1955/ASR
SFR/D 19404 Ronald AVE $1,177,000 $1,019 3/1,1,0,0 1155/A 1956/ASR
SFR/D 4621 Toucan ST $1,199,000 $705 3/1,1,0,0 1701/A 1954/ASR
SFR/D 4619 Bulova $1,315,000 $857 3/2,0,0,0 1535/A 1954/ASR
SFR/D 5401 Norton ST $1,340,000 $674 4/3,0,0,0 1988/A 1956/ASR
SFR/D 20104 Ingrum WAY $1,350,000 $659 5/1,1,0,0 2050/A 1955/ASR
SFR/D 4818 Darien ST $1,450,000 $728 4/2,0,0,0 1992/A 1956/ASR
SFR/D 20733 Christine AVE $1,600,000 $784 4/1,1,1,0 2040/A 1959/ASR
TWNHS/A 3446 W 170th ST $735,000 $477 3/2,0,1,0 1542/A 1974/ASR
SFR/D 3404 W 188th ST $770,000 $953 2/1,0,0,0 808/A 1950/ASR
SFR/D 16921 Elgar AVE $805,000 $830 3/1,0,0,0 970/E 1949/ASR
SFR 3825 W 170th ST $850,000 $762 3/2,0,0,0 1116/ 1953
SFR/D 18026 Faysmith AVE $868,500 $625 4/2,0,0,0 1390/A 1953/ASR
SFR/D 18814 Felbar AVE $985,000 $758 3/2,0,0,0 1300/A 1955/ASR
SFR/D 3209 W 180th ST $985,000 $750 3/1,1,0,0 1313/P 1955/PUB
TWNHS/A 18536 Ashley AVE $985,000 $596 3/2,0,0,0 1654/A 1990/ASR
SFR/D 3735 W 168th ST $1,020,000 $791 3/2,0,0,0 1289/A 1956/ASR
SFR/D 3113 W 187th PL $1,169,000 $555 4/2,0,1,0 2107/AP 1950/ASR
SFR/D 3922 W 185th ST $1,199,000 $685 3/1,1,0,0 1750/E 1956/ASR
SFR/D 16927 Wilkie Ave $860,500 $674 3/1,0,0,0 1276/A 1953/ASR
SFR/D 1933 West 180th PL $880,000 $571 3/1,1,0,0 1540/A 1957/ASR
SFR/D 16405 Chanera AVE $915,000 $761 3/1,1,0,0 1202/A 1951/PUB
SFR/D 2824 W 167th ST $925,000 $704 3/1,1,0,0 1314/A 1954/ASR
SFR/D 18511 Manhattan PL $990,000 $597 4/0,2,0,0 1658/A 1962/ASR
SFR/D 2864 W 164th ST $1,050,000 $576 3/2,0,1,0 1823/A 1993/ASR
SFR 1842 W 180th ST $1,271,000 $612 4/2,0,0,0 2076/A 1968/ASR
CONDO/A 1301 Cabrillo AVE #117 $466,000 $769 1/1,0,0,0 606/A 1993/ASR
CONDO 1262 Engracia AVE $650,000 $740 2/1,0,1,0 878/ 2005
CONDO/A 2367 Jefferson ST #311 $775,000 $615 2/2,0,0,0 1261/A 2007/ASR
TWNHS/A 2136 Washington AVE $786,000 $570 2/3,0,0,0 1379/A 2006/ASR
TWNHS/A 2102 Washington AVE $795,000 $577 2/2,0,1,0 1379/A 2006/PUB
SFR/D 1719 Gramercy AVE $865,000 $402 4/2,1,0,0 2150/AP 1912/ASR
TWNHS/A 1630 Gramercy AVE #4 $869,000 $530 3/1,1,1,0 1640/A 2010/ASR
TWNHS/D 2602 Cabrillo AVE $930,000 $476 4/2,0,1,0 1952/A 1990/ASR
DPLX/D 1819 Andreo AVE $1,100,000 $701 3/2,1,0,0 1570/A 1924/ASR
TWNHS/A 23524 B Arlington AVE #B $702,000 $628 2/2,0,1,0 1118/P 1986/PUB
SFR/D 2363 W 229th Place $785,000 $748 3/1,0,1,0 1050/A 1945/ASR
TWNHS/A 22714 Cypress ST $788,888 $574 3/2,0,1,0 1374/A 1974/APP
SFR/D 2351 W 229 PL $860,000 $432 3/2,0,0,0 1991/A 1945/ASR
SFR/D 2143 W 235th ST $1,160,000 $682 3/2,0,1,0 1700/A 1964/ASR
SFR/D 2449 W 229th ST $1,450,000 $598 4/1,2,0,0 2423/A 1965/ASR
MANL/D 20563 Palm WAY $80,000 $92 2/1,0,1,0 872/P 1965

Filed Under: Home Prices, Homes for Sale, Realtor Keith Kyle, Torrance home prices, Torrance Real Estate, Torrance Realtors Tagged With: torrance home prices, torrance home prices in september, torrance home sales, torrance market update, torrance real estate market

August 2022 Torrance Real Estate – Market At a Glance

September 13, 2022 by Keith Kyle

August 2022 Torrance Real Estate Recap

Welcome to the August real estate market overview for home sales in Torrance  CA.

For a more in-depth look view the homes that sold during August 2022 or vist our Torrance real estate trends and statistics to see how August compares with previous months to get a better idea of where the market is heading.

Overall August 2022 cooled a bit for home sales in Torrance with 86 on market closed sales.

The median home price was $990,000 with an average price per foot of $667 and only 17 days on market.

View the current homes for sale in Torrance

Filed Under: Home Prices, Homes for Sale, Torrance CA real estate market, Torrance home prices, Torrance homes for sale, Torrance Real Estate Tagged With: home prices in torrance, torrance home prices, torrance home sales, torrance homes for sale, torrance real estate market

  • « Previous Page
  • 1
  • …
  • 4
  • 5
  • 6
  • 7
  • 8
  • …
  • 16
  • Next Page »
  • FREE Listing Updates
  • What’s Your Home Worth?
  • Search Torrance CA Homes For Sale and Current Listings