It was back to being a big month for home sales and home prices in Torrance CA during March. We saw 107 on MLS closed home sales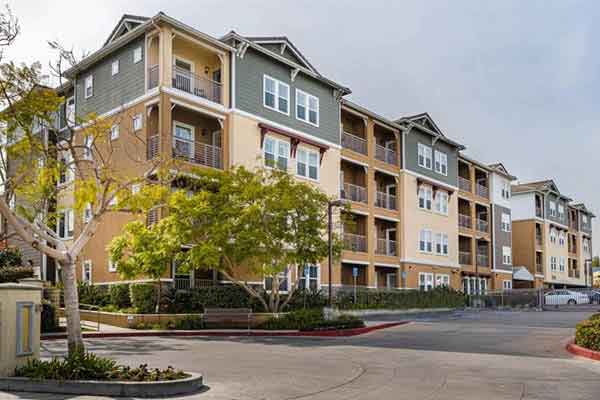 which was a increase from February in which there were 76 sold homes.
The average “list” price for the homes that sold during March was $996,628 with the average sold price at $1,056,201 meaning that homes generally sold WAY over the asking price.
The average price per foot for the month was $693. The average days on market was a very short 13 with the median days on market an amazing 7 before going into pending status. See how that compares with other months on our Torrance real estate trends and statistics page.
Search the current homes for sale in Torrance
March 2022 Torrance Home Sales and Prices
| Type | Address | Price | $ Per Sq Foot | Bed/Bath | Sq Feet | Year Built | |
| SFR/D | 1524 W | 220th ST | $680,000 | $1,288 | 1/1,0,0,0 | 528/A | 1924/ASR |
| SFR/D | 1259 W | 213th ST | $750,000 | $579 | 3/2,0,0,0 | 1295/A | 1959/ASR |
| SFR/D | 1045 W | 209th ST | $912,000 | $576 | 4/2,0,0,0 | 1582/A | 1953/ASR |
| CONDO | 20555 S | Vermont AVE #4 | $400,000 | $605 | 1/1,0,0,0 | 661/ | 1982 |
| CONDO | 1115 | Sepulveda Blvd #G102 | $435,000 | $546 | 2/1,0,0,0 | 796/OTH | 1973 |
| CONDO/A | 946 | W. 220th St. #103 | $520,000 | $458 | 2/1,0,1,0 | 1135/A | 1981/ASR |
| TWNHS | 834 W | 232ND ST | $630,000 | $645 | 2/2,0,0,0 | 976/ | 1974 |
| SFR/D | 906 | Gastine ST | $805,000 | $797 | 3/1,0,0,0 | 1010/A | 1953/ASR |
| SFR/D | 957 W | 232nd ST | $850,000 | $763 | 3/1,0,0,0 | 1114/A | 1956/ASR |
| CONDO/D | 1233 | Jasmine | $880,000 | $483 | 3/2,0,1,0 | 1822/A | 2005/ASR |
| TWNHS | 23238 | Marigold AV | $880,000 | $405 | 4/3,0,1,0 | 2171/ | 2021/BLD |
| TWNHS | 23246 | Marigold AV | $885,000 | 4/3,0,1,0 | / | 2022/BLD | |
| TWNHS | 23232 | Marigold AV | $893,000 | $411 | 4/3,0,1,0 | 2171/ | 2021/BLD |
| TWNHS | 23236 | Marigold AV | $895,000 | 4/3,0,1,0 | / | 2022/BLD | |
| TWNHS | 23234 | Marigold AV | $895,000 | $412 | 4/3,0,1,0 | 2171/ | 2022/BLD |
| SFR/D | 1125 | Begonia WAY | $1,100,000 | $504 | 4/2,0,1,0 | 2181/A | 1989/ASR |
| TWNHS/A | 24444 | Hawthorne BLVD #107 | $930,000 | $777 | 2/2,0,1,0 | 1197/A | 2017/ASR |
| SFR/D | 3240 | Danaha ST | $1,225,000 | $840 | 3/2,0,0,0 | 1459/A | 1950/ASR |
| SFR/D | 3502 | Cricklewood ST | $1,245,000 | $799 | 4/2,0,0,0 | 1559/A | 1951/ASR |
| SFR/D | 4134 | Pacific Coast Highway #114 | $1,250,000 | $549 | 4/3,0,1,0 | 2278/A | 2001/ASR |
| SFR/D | 3244 | Whiffletree LN | $1,300,000 | $702 | 3/3,0,0,0 | 1852/A | 1975/ASR |
| CONDO/A | 3220 | Merrill Drive #31 | $520,000 | $604 | 1/1,0,0,0 | 861/P | 1964/PUB |
| CONDO/A | 2605 | Sepulveda BLVD #127 | $639,000 | $527 | 2/3,0,0,0 | 1212/A | 2003/PUB |
| CONDO/A | 2559 | Plaza Del Amo #208 | $655,000 | $623 | 1/1,0,1,0 | 1052/A | 1984/ASR |
| TWNHS/A | 2931 | Plaza Del Amo #90 | $793,000 | $670 | 2/2,0,1,0 | 1184/A | 1985/ASR |
| TWNHS/A | 2971 | Plaza Del Amo #257 | $815,000 | $599 | 2/3,0,0,0 | 1361/A | 1985/ASR |
| TWNHS/A | 3534 | Del Amo BLVD #55 | $900,000 | $543 | 4/2,0,1,0 | 1657/A | 1974/ASR |
| SFR/D | 1122 | Fonthill AVE | $900,000 | $820 | 3/1,0,0,0 | 1097/A | 1951/ASR |
| TWNHS/A | 2300 | Maple AVE #170 | $950,000 | $547 | 3/2,0,1,0 | 1738/A | 1988/ASR |
| SFR/D | 2667 | Monterey ST | $1,099,000 | $762 | 3/1,0,1,0 | 1442/A | 1955/ASR |
| SFR/A | 1317 | Cordary AVE | $1,110,000 | $804 | 3/2,0,0,0 | 1381/A | 1951/ASR |
| SFR/D | 2815 | Sepulveda BLVD #21 | $1,203,000 | $511 | 3/2,0,1,0 | 2354/P | 2001/PUB |
| SFR/D | 2889 | Plaza Del Amo #211 | $1,278,000 | $559 | 3/3,0,0,0 | 2285/A | 2002/ASR |
| CONDO/D | 2113 | Atwood WAY | $1,325,000 | $594 | 3/3,0,0,0 | 2231/A | 1987/ASR |
| SFR/D | 20502 | Avis AVE | $1,330,000 | $878 | 3/1,1,0,0 | 1514/A | 1958/ASR |
| SFR/D | 2817 | Maricopa ST | $1,450,000 | $467 | 4/3,1,0,0 | 3102/A | 2007/ASR |
| SFR/D | 3600 | Sara DR | $1,483,350 | $704 | 4/1,1,0,0 | 2108/A | 1964/ASR |
| CONDO/A | 22819 | Nadine CIR #B | $530,000 | $558 | 2/2,0,0,0 | 950/A | 1963/ASR |
| CONDO/A | 22956 | Nadine CIR #B | $588,000 | $619 | 2/2,0,0,0 | 950/A | 1963/ASR |
| CONDO/A | 22605 | Nadine CIR | $610,000 | $631 | 2/1,0,1,0 | 967/A | 1963/ASR |
| CONDO/A | 23012 | Nadine CIR | $670,000 | $591 | 2/2,0,0,0 | 1133/A | 1963/ASR |
| TWNHS/A | 23057 | Samuel ST #9 | $735,000 | $717 | 2/3,0,0,0 | 1025/A | 1995/PUB |
| SFR/D | 2219 W | 230th ST | $900,000 | $693 | 3/2,0,0,0 | 1299/A | 1961/ASR |
| TWNHS/A | 3014 W | 235th ST | $990,000 | $569 | 3/3,0,0,0 | 1739/A | 2000/ASR |
| SFR/D | 4069 | Bluff ST | $1,185,000 | $786 | 3/2,0,0,0 | 1508/A | 1948/ASR |
| SFR/D | 4501 | Via Corona | $1,350,000 | $464 | 3/3,0,0,0 | 2907/A | 1968/ASR |
| SFR/D | 5410 | Calle De Ricardo | $1,455,000 | $907 | 4/2,0,0,0 | 1605/A | 1956/ASR |
| CONDO/A | 2800 | Plaza Del Amo #310 | $750,000 | $689 | 2/2,0,1,0 | 1088/P | 1988/PUB |
| TWNHS/D | 23824 | Los Codona AVE #2 | $1,055,000 | $529 | 3/2,0,1,0 | 1994/A | 1996/ASR |
| SFR/D | 4830 | Theo AVE | $1,150,000 | $1,092 | 3/1,0,0,0 | 1053/A | 1953/ASR |
| SFR/D | 4312 W | 230th ST | $1,301,000 | $934 | 3/2,0,0,0 | 1393/A | 1954/ASR |
| SFR/D | 22908 | Kathryn AVE | $1,400,000 | $1,228 | 3/1,0,0,0 | 1140/A | 1954/ASR |
| SFR/D | 23440 | Kathryn AVE | $1,580,000 | $963 | 4/0,2,0,0 | 1641/A | 1962/PUB |
| SFR/D | 23819 | Ladeene AVE | $1,775,821 | $611 | 5/3,0,0,0 | 2905/A | 1962/ASR |
| SFR/D | 4813 | Bindewald RD | $2,300,000 | $1,241 | 4/1,1,0,0 | 1854/A | 1956/ASR |
| CONDO | 21345 | Hawthorne BLVD #304 | $660,000 | $725 | 2/1,1,0,0 | 910/A | 2005/ASR |
| SFR/D | 5222 W | Carson ST | $1,260,000 | $681 | 4/3,0,0,0 | 1850/A | 1955/PUB |
| SFR | 5103 | Carmen ST | $1,415,000 | $1,204 | 3/2,0,0,0 | 1175/ | 1955 |
| SFR/D | 4005 | Merrill ST | $1,420,000 | $1,229 | 3/2,0,0,0 | 1155/A | 1956/ASR |
| SFR/D | 21222 | Ladeene AVE | $1,660,000 | $780 | 4/3,0,0,0 | 2129/A | 1956/ASR |
| SFR/D | 4626 | Cathann ST | $1,745,000 | $795 | 4/2,0,1,0 | 2195/A | 1965/ASR |
| TWNHS/A | 4258 | Spencer ST | $1,038,000 | $441 | 2/3,0,0,0 | 2355/A | 1989/PUB |
| SFR/D | 5103 | Cadison ST | $1,285,000 | $857 | 4/2,0,0,0 | 1500/E | 1954/ASR |
| SFR/D | 19529 | Donora AVE | $1,290,000 | $857 | 3/2,0,0,0 | 1506/A | 1955/ASR |
| SFR/D | 5216 | Emerald ST | $1,340,000 | $1,030 | 3/2,0,0,0 | 1301/A | 1959/ASR |
| SFR/D | 4708 | Michelle DR | $1,360,000 | $776 | 3/1,1,0,0 | 1753/A | 1960/ASR |
| SFR/D | 4903 | Maricopa ST | $1,505,000 | $665 | 4/3,0,0,0 | 2262/A | 1962/ASR |
| SFR/D | 19816 | Tomlee AVE | $1,640,000 | $984 | 3/1,1,0,0 | 1667/A | 1970/ASR |
| SFR/D | 20605 | Mansel AVE | $1,685,000 | $621 | 5/2,1,0,0 | 2714/A | 1960/ASR |
| SFR/D | 18432 | Elgar AVE | $850,000 | $792 | 3/1,0,0,0 | 1073/A | 1953/ASR |
| SFR | 3605 W | 182Nd ST | $850,000 | $599 | 3/2,0,0,0 | 1420/A | 1953/ASR |
| SFR/A | 3127 W | 177th ST | $925,000 | $610 | 4/1,1,0,0 | 1517/A | 1955/ASR |
| SFR/D | 2510 W | 178th ST | $960,000 | $834 | 3/2,0,0,0 | 1151/A | 1955/PUB |
| SFR/D | 4126 W | 177th ST | $1,010,000 | $732 | 3/0,1,1,0 | 1380/A | 1952/ASR |
| SFR/D | 3721 W | 185th ST | $1,018,000 | $767 | 3/1,0,1,0 | 1327/A | 1956/PUB |
| SFR | 18811 | Yukon AVE | $1,053,300 | $643 | 3/1,1,0,0 | 1637/ | 1953 |
| SFR/D | 3321 W | 166th ST | $1,130,000 | $756 | 3/2,0,0,0 | 1494/A | 1952/ASR |
| CONDO | 18512 | ROSLIN AVE | $1,140,000 | $585 | 3/4,0,0,0 | 1950/A | 2017/ASR |
| SFR/D | 3711 | Sandgate DR | $1,140,000 | $648 | 5/2,0,0,0 | 1758/A | 1960/ASR |
| SFR/D | 3611 W | 187th ST | $1,280,000 | $685 | 4/2,0,0,0 | 1868/A | 1954/ASR |
| SFR/D | 16606 | Delia AVE | $1,280,000 | $558 | 4/2,0,0,0 | 2295/A | 1974/ASR |
| SFR/D | 4124 W | 184th PL | $1,400,000 | $552 | 4/1,1,1,0 | 2535/A | 1955/PUB |
| SFR/D | 18414 | Van Ness AVE | $765,000 | $617 | 3/1,0,1,0 | 1240/A | 1955/ASR |
| SFR/D | 17025 | Kristin AVE | $1,070,000 | $695 | 4/3,0,0,0 | 1540/A | 1955/ASR |
| SFR/D | 2615 W | 166th PL | $1,120,000 | $650 | 3/1,1,0,0 | 1722/SEE | 1955/PUB |
| SFR/D | 18220 | Yukon AVE | $1,149,000 | $668 | 3/2,0,0,0 | 1720/A | 1954/ASR |
| SFR/D | 16808 | Atkinson AVE | $1,316,000 | $798 | 4/2,0,0,0 | 1649/A | 1954/ASR |
| CONDO/A | 2742 | Cabrillo AVE #110 | $391,500 | $584 | 1/1,0,0,0 | 670/A | 2006/ASR |
| SFR/D | 720 | Cota AVE | $685,000 | $1,007 | 2/1,0,0,0 | 680/A | 1918/ASR |
| TWNHS/A | 2244 | Dominguez ST | $799,000 | $555 | 3/2,0,1,0 | 1440/A | 2005/ASR |
| CONDO/A | 2349 | Jefferson ST #303 | $857,500 | $681 | 2/2,0,0,0 | 1260/A | 2008/ASR |
| SFR/D | 1819 W | 228th ST | $880,000 | $688 | 3/2,0,0,0 | 1280/A | 1956/ASR |
| TWNHS/D | 1840 | Torrance Blvd | $890,000 | $536 | 2/2,0,1,0 | 1660/AP | 2000/ASR |
| SFR/D | 2404 | Gramercy AVE | $900,000 | $659 | 3/1,1,0,0 | 1366/A | 1944/ASR |
| TWNHS/D | 2743 | Gramercy AVE | $950,000 | $575 | 3/3,0,0,0 | 1651/A | 1989/ASR |
| TWNHS/A | 1800 | Oak ST #618 | $950,000 | $480 | 2/3,0,0,0 | 1980/A | 2007/ASR |
| SFR/D | 2353 | Sonoma St | $1,000,000 | $1,124 | 2/1,0,0,0 | 890/A | 1929/ASR |
| SFR/D | 1537 | Marcelina | $1,163,000 | $797 | 4/2,0,0,0 | 1460/P | 1922/ASR |
| SFR/D | 1824 | Andreo AVE | $1,486,000 | $671 | 3/3,0,0,0 | 2214/A | 1991/ASR |
| CONDO/A | 24410 | Crenshaw BLVD #217 | $515,000 | $464 | 2/2,0,0,0 | 1111/A | 1987/PUB |
| SFR/D | 24256 | Huber AVE | $820,000 | $633 | 3/2,0,0,0 | 1296/A | 1954/ASR |
| SFR/D | 1927 W | 236th ST | $1,170,000 | $599 | 4/1,1,0,0 | 1954/A | 1973/PUB |
| SFR/D | 23715 | Walter AVE | $1,225,000 | $705 | 3/1,1,0,0 | 1737/A | 1956/ASR |
| SFR/D | 2411 W | 228th ST | $1,251,000 | $516 | 4/3,0,0,0 | 2423/A | 1965/ASR |
| SFR/D | 2351 W | 227th ST | $1,425,000 | $626 | 4/2,0,1,0 | 2278/A | 1972/ASR |
| TWNHS/D | 1221 | Valle CT | $885,000 | $486 | 3/3,0,0,0 | 1822/A | 2005/ASR |
 trended up from the previous year in terms of median home prices with only a few local cities seeing a decrease in y over year prices.
 norm but there was really no sense to it with some cities seeing major increases over June of 2016 and some seeing just as major drops in home prices.