See the Most Expensive Home Sale In Torrance in April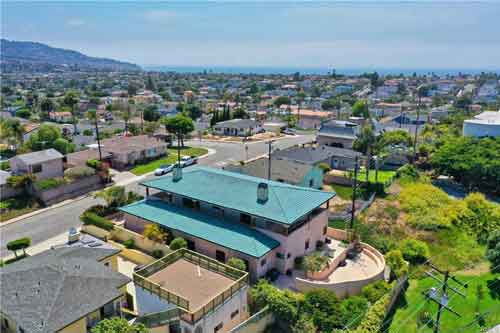
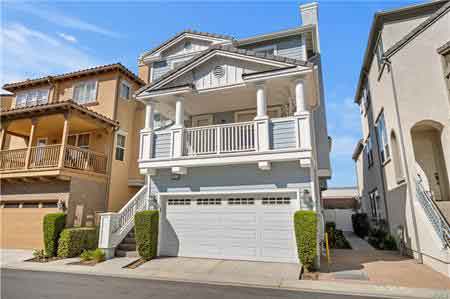
5609 Avenue A, Torrance – Just Sold at $2,399,000
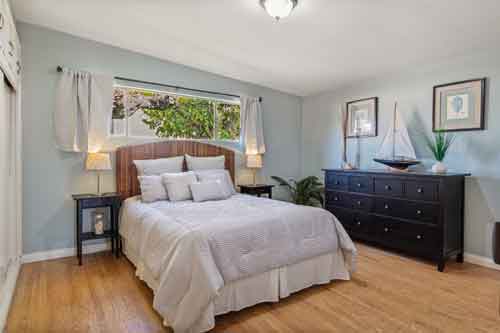
The highest priced home sale in Torrance during April was a big home with some views. It was a fairly unusual home that was relatively new but felt a bit dated. Having said that the home offered almost 4,000 square feet and sat perched on the rise featuring views in several different directions. The home had great outdoor space with almost 1200 feet of patio and lanai. Views ranged from downtown LA to the harbor to even a slight ocean view.
5609 Avenue A Basics
- 4 bedrooms
- 4 bathrooms
- 3,808 sq feet (buyer to verify)
- Built in 2007
- 5,801 sq foot lot
- Listed by Teri Hawkins – RE/MAX Estate Properties – 310-544-9999
5609 Avenue A, Torrance, CA 90505 – Sold at $2,399,000
Any information relating to a property referenced on this web site comes from CRMLS. This web site may reference real estate listing(s) held by a brokerage firm other than the broker and/or agent who owns this website. The accuracy of all information is deemed reliable but not guaranteed and should be personally verified through personal inspection by and/or with the appropriate professionals.