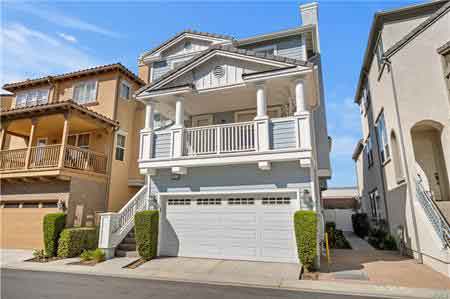
Let’s take a quick look at the Torrance real estate market in 2022 and how each month fared. 
There were 1,103 homes, condos and townhomes in Torrance sold during 2022 with an average “list” price of $997,659 and an average sold price of $1,029,793. The median listing price was $949,888 and the median sold price was $960,000. Homes averaged only 18 days on the market before going into escrow. The median days on market was an incredibly low 9 before going into escrow.
As is the norm the summer months were the busiest with the market much slower from December through April.
| Date | Jan | Feb | March | April | May | June | July | August | Sept | Oct | Nov | Dec |
| For Sale | 47 | 52 | 76 | 67 | 101 | 150 | 135 | 137 | 126 | 139 | 113 | 91 |
| Sold | 76 | 71 | 107 | 129 | 109 | 111 | 111 | 87 | 84 | 77 | 61 | 74 |
| Avg. List Price | $928K | $1,018M | $1,112M | $1,153M | $1,246M | $1,119M | $1,159M | $1,139M | $ 1,165M | $1,083M | $1,032M | $1,018M |
| Avg. Sold Price | $963K | $ 968K | $1.056M | $1,048M | $ 1,111M | $1,063M | $1,027M | $1,047M | $1,004M | $1,043M | $ 976K | $ 967K |
| Avg. Sq. Ft. Price (Sold) | 641 | 700 | 667 | 701 | 753 | 710 | 689 | 668 | 673 | 671 | 616 | 601 |
| Avg Days on Market | 20 | 14 | 10 | 12 | 11 | 9 | 15 | 17 | 24 | 27 | 28 | 43 |