As of 1/15 the lowest priced home currently for sale (excluding manufactured homes) is a one bedroom single level condo in the 55+ senior complex of Sunset Gardens. The home offers 1 bedroom, 1 bath and approximately 669 sq feet.
September Property Sales and Home Prices in Torrance
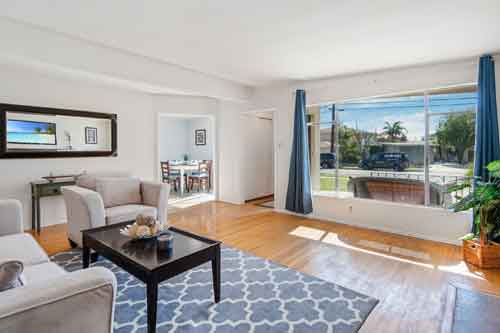
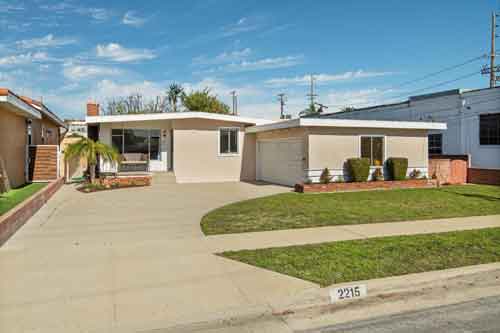
Torrance saw another great month for home sales and home prices. 122 homes closed escrow during the month which is the highest number of home sales in years. Take a look below at all of the homes that sold. The highest priced home sale of the month was 4,000+ square foot single family 5 bedroom home at 5531 Laurette in the neighborhood of Southwood
View the current Torrance homes, townhomes and condos for sale
September 2020 Home Sales and House Prices
| Type | Address | Price | $ Per Foot | Bed/Bath | Sq Feet | Year | |
| SFR/D | 21224 | Doble Ave | $640,000 | $494 | 3/2,0,0,0 | 1295/E | 1960 |
| SFR/D | 1624 W | 220th ST | $650,000 | $434 | 2/2,0,0,0 | 1496/E | 1930/ASR |
| SFR/D | 1518 W | 213th ST | $770,000 | $439 | 3/3,0,0,0 | 1754/A | 1943/EST |
| CONDO/A | 23332 | Sesame ST #D | $220,000 | $530 | 0/1,0,0,0 | 415/A | 1973/EST |
| CONDO/A | 23300 | Sesame ST #36D | $242,500 | $584 | 0/1,0,0,0 | 415/A | 1973/ASR |
| CONDO | 23330 | Sesame ST #A | $304,000 | $513 | 1/1,0,0,0 | 593/ | 1973 |
| CONDO | 20434 S | Vermont AVE #67 | $315,000 | $480 | 1/0,1,0,0 | 656/ | 1978 |
| CONDO/A | 20614 S | Vermont AVE #39 | $331,000 | $505 | 1/1,0,0,0 | 656/A | 1978/ASR |
| CONDO/A | 1109 | Sepulveda BLVD #E103 | $340,000 | $550 | 1/1,0,0,0 | 618/A | 1973/PUB |
| CONDO/A | 1125 | Sepulveda BLVD #K103 | $340,000 | $550 | 1/1,0,0,0 | 618/A | 1973/ASR |
| CONDO/A | 1123 | Sepulveda BLVD #J104 | $367,500 | $462 | 2/1,0,0,0 | 796/A | 1973/OTH |
| CONDO/A | 1117 | Sepulveda BLVD #2-102 | $390,000 | $467 | 2/2,0,0,0 | 836/A | 1973/ASR |
| CONDO/A | 23212 | Sesame ST #A | $420,000 | $395 | 3/1,0,1,0 | 1064/A | 1973/ASR |
| CONDO/A | 20561 S | Vermont AVE #2 | $423,500 | $438 | 2/2,0,0,0 | 968/A | 1982/ASR |
| TWNHS | 22324 | Harbor Ridge LN #5 | $470,000 | $365 | 3/1,0,1,0 | 1287/A | 1979/ASR |
| SFR/D | 22923 | Alexandria AVE | $508,000 | $461 | 3/1,0,1,0 | 1102/A | 1981/ASR |
| SFR/D | 1049 | Jay ST | $590,000 | $590 | 3/1,0,0,0 | 1000/A | 1954/ASR |
| TWNHS/A | 22919 | Mariposa AVE #303 | $590,000 | $366 | 3/4,0,0,0 | 1610/A | 2009/ASR |
| SFR/D | 22727 | Menlo AVE | $665,000 | $435 | 3/2,0,0,0 | 1529/A | 1969/ASR |
| TWNHS/D | 22732 | Meyler ST | $682,000 | $413 | 3/2,1,0,0 | 1650/A | 2016/ASR |
| SFR/D | 20913 S | Van Deene AVE | $685,000 | $458 | 3/2,0,0,0 | 1495/AP | 1957/ASR |
| TWNHS/D | 1221 | Jasmine Walk | $720,000 | $395 | 3/2,0,1,0 | 1822/A | 2004/SLR |
| CONDO/A | 24450 | Ward Street | $750,000 | $526 | 3/1,1,0,0 | 1427/A | 1981/ASR |
| SFR/D | 2709 | Normallin ST | $865,000 | $718 | 3/2,0,0,0 | 1204/A | 1953/ASR |
| SFR/D | 2741 | Grand Summit RD | $869,998 | $814 | 3/1,0,0,0 | 1069/A | 1954/ASR |
| SFR/D | 3204 | Danaha ST | $950,000 | $469 | 4/2,0,0,0 | 2027/A | 1953/ASR |
| CONDO/D | 24238 | OCEAN AVE | $980,000 | $463 | 3/2,0,1,0 | 2115/B | 2020/BLD |
| SFR/D | 26017 | Calmhill DR | $995,000 | $820 | 3/0,2,0,0 | 1214/A | 1955/PUB |
| CONDO/D | 24240 | OCEAN AVE | $1,105,000 | $522 | 3/2,0,1,0 | 2115/B | 2020/BLD |
| CONDO/D | 24236 | OCEAN AVE | $1,115,000 | $527 | 3/2,0,1,0 | 2115/B | 2020/BLD |
| SFR | 2905 | OAKWOOD LN | $1,150,000 | $618 | 3/3,0,0,0 | 1860/ | 1976/ASR |
| SFR/D | 2854 | WINDMILL RD | $1,175,000 | $694 | 3/2,0,0,0 | 1692/A | 1976/ASR |
| SFR/D | 3207 | Carolwood LN | $1,245,000 | $615 | 3/3,0,1,0 | 2026/A | 1977/ASR |
| SFR/D | 24411 | Neece AVE | $1,375,000 | $535 | 4/2,0,1,0 | 2572/A | 2001/ASR |
| SFR/D | 2503 | Loftyview DR | $1,399,000 | $368 | 5/3,0,1,0 | 3804/SEE | 2004/ASR |
| CONDO/A | 3550 | Torrance BLVD #109 | $369,000 | $647 | 1/1,0,0,0 | 570/A | 2006/PUB |
| CONDO/A | 3230 | Merrill DR #74 | $410,000 | $476 | 2/1,0,0,0 | 861/A | 1964/ASR |
| CONDO/A | 3230 | Merrill DR #61 | $432,500 | $502 | 2/1,0,0,0 | 861/SEE | 1964/ASR |
| CONDO/A | 2940 W | Carson ST #113 | $455,000 | $484 | 2/2,0,0,0 | 941/A | 1962/ASR |
| CONDO/A | 2940 W | Carson ST #224 | $475,000 | $591 | 2/1,0,0,0 | 804/A | 1962/ASR |
| SFR/D | 1621 | Crenshaw BLVD | $555,000 | $1,076 | 2/1,0,0,0 | 516/A | 1924/PUB |
| TWNHS/A | 2931 | Plaza Del Amo #46 | $645,000 | $544 | 2/2,0,1,0 | 1186/A | 1985/ASR |
| CONDO | 2595 | Plaza Del Amo #427 | $727,000 | $509 | 2/2,0,1,0 | 1429/T | 1986 |
| CONDO/A | 2577 | Plaza Del Amo #706 | $750,000 | $551 | 2/2,0,1,0 | 1362/A | 1987/ASR |
| SFR/D | 1605 | Date AVE | $770,000 | $759 | 2/1,0,0,0 | 1015/A | 1956/ASR |
| TWNHS/A | 2825 | Plaza Del Amo #166 | $790,000 | $430 | 3/3,0,0,0 | 1839/A | 1994/ASR |
| TWNHS/A | 3446 | Del Amo BLVD | $805,000 | $482 | 4/2,0,1,0 | 1670/A | 1974/PUB |
| SFR/A | 2815 | SEPULVEDA BLVD #9 | $895,000 | $383 | 3/3,0,0,0 | 2334/A | 2001/ASR |
| SFR/D | 2889 | Plaza Del Amo #912 | $1,000,000 | $438 | 3/2,0,1,0 | 2285/A | 2003/ASR |
| CONDO/A | 22883 #B | Nadine Circle | $420,000 | $376 | 1/1,1,0,0 | 1117/AP | 1963/ASR |
| CONDO/A | 23063 | Nadine Circle A | $505,000 | $452 | 2/1,1,0,0 | 1117/A | 1963/ASR |
| CONDO/A | 22936 | Nadine CIR #B | $520,000 | $547 | 1/1,0,1,0 | 950/A | 1963/ASR |
| CONDO/A | 22947 | Maple AVE | $577,640 | $517 | 2/1,1,0,0 | 1117/A | 1963/ASR |
| CONDO/D | 24410 | Crenshaw BLVD #321 | $599,000 | $362 | 3/2,0,0,0 | 1654/A | 1987/ASR |
| TWNHS/A | 2752 W | 235th ST | $685,000 | $489 | 2/2,0,0,0 | 1400/B | 1999/ASR |
| SFR/D | 3703 W | 225th ST | $863,000 | $636 | 3/1,0,1,0 | 1356/A | 1953/ASR |
| SFR/D | 22313 | Ward ST | $899,000 | $701 | 4/2,0,0,0 | 1283/A | 1956/ASR |
| SFR/D | 2625 W | 225th ST | $965,000 | $600 | 4/2,0,0,0 | 1609/A | 1960/ASR |
| SFR/D | 2743 W | 233rd ST | $1,120,000 | $556 | 4/2,0,0,0 | 2013/A | 1965/ASR |
| SFR/D | 23108 | Greenwood AVE | $1,195,000 | $678 | 4/2,0,0,0 | 1763/A | 1965/ASR |
| SFR/D | 22603 | Felbar AVE | $1,303,000 | $558 | 4/3,0,1,0 | 2337/A | 1963/ASR |
| SFR/D | 23402 | Susana AVE | $1,152,600 | $1,037 | 3/1,0,1,0 | 1112/A | 1954/ASR |
| SFR/D | 5416 | Riviera WAY | $1,280,000 | $826 | 3/2,0,1,0 | 1549/A | 1954/ASR |
| SFR/D | 23206 | Anza AVE | $859,000 | $559 | 3/2,0,0,0 | 1536/A | 1960/PUB |
| SFR/D | 22708 | Linda DR | $1,000,000 | $940 | 3/2,0,0,0 | 1064/A | 1952/ASR |
| SFR/D | 22914 | Kent AVE | $1,108,000 | $511 | 5/3,0,0,0 | 2167/A | 1955/ASR |
| SFR/D | 22718 | Evalyn AVE | $1,200,000 | $716 | 4/3,0,0,0 | 1675/A | 1953/ASR |
| SFR/D | 5404 | Palos Verdes BLVD | $1,250,000 | $640 | 3/1,1,0,1 | 1952/A | 1952/ASR |
| SFR/D | 5110 | Milne DR | $1,359,000 | $558 | 4/2,1,0,0 | 2435/A | 1952/ASR |
| SFR | 3850 W | 230th St. ST | $1,570,000 | $470 | 4/3,0,0,0 | 3342/ | 1990 |
| SFR/D | 21922 | Ladeene AVE | $865,000 | $744 | 3/1,1,0,0 | 1162/A | 1956/ASR |
| SFR/D | 21701 | Ocean AVE | $950,000 | $531 | 4/2,0,0,0 | 1790/A | 1956/ASR |
| SFR/D | 21517 | Ladeene AVE | $1,030,000 | $660 | 3/2,0,0,0 | 1560/A | 1956/PUB |
| SFR | 4709 W | Carson ST | $1,042,000 | $677 | 3/2,0,0,0 | 1539/B | 1955 |
| SFR/D | 21901 | Redbeam AVE | $1,100,000 | $947 | 3/2,0,0,0 | 1162/A | 1955/ASR |
| SFR/D | 4927 | Jacques ST | $1,175,000 | $556 | 4/2,0,0,0 | 2114/A | 1955/EST |
| SFR/D | 5531 | Laurette ST | $1,885,000 | $462 | 5/1,3,1,0 | 4083/A | 2005/ASR |
| CONDO/A | 4520 | Emerald ST | $705,000 | $476 | 2/2,0,1,0 | 1480/P | 1981/PUB |
| TWNHS/A | 4418 | Spencer ST | $857,500 | $340 | 3/2,0,1,0 | 2525/A | 1984/ASR |
| SFR/D | 19445 | Sturgess DR | $930,000 | $530 | 3/2,0,0,0 | 1754/A | 1956/ASR |
| SFR/D | 5507 | Norton ST | $955,000 | $853 | 3/1,1,0,0 | 1120/A | 1956/ASR |
| SFR/D | 20135 | Talisman ST | $960,000 | $727 | 3/1,1,0,0 | 1320/A | 1955/PUB |
| SFR/D | 5313 | Carmelynn AVE | $970,000 | $615 | 3/1,1,0,0 | 1577/A | 1956/ASR |
| SFR/D | 4726 | Carmelynn ST | $995,000 | $709 | 3/1,1,0,0 | 1403/A | 1955/ASR |
| SFR/D | 4701 | Steele ST | $1,140,000 | $602 | 3/2,0,1,0 | 1894/A | 1986/ASR |
| SFR/D | 5010 | Onyx ST | $1,275,000 | $553 | 4/2,0,0,0 | 2307/A | 1961/APP |
| SFR/D | 5540 | Norton ST | $1,845,000 | $530 | 4/4,0,0,0 | 3481/P | 1989/PUB |
| TWNHS/A | 3888 | Redondo Beach BLVD | $609,600 | $535 | 2/2,0,1,0 | 1140/A | 2005/ASR |
| SFR/D | 17404 | Elgar AVE | $700,000 | $658 | 3/1,0,0,0 | 1064/A | 1951/ASR |
| SFR/D | 18926 | Florwood | $700,000 | $711 | 3/1,0,0,0 | 985/A | 1953/ASR |
| TWNHS/A | 18050 | Prairie AVE #A | $700,000 | $482 | 3/2,0,1,0 | 1452/A | 1989/ASR |
| SFR/D | 17011 | Osage AVE | $765,000 | $574 | 3/1,1,0,0 | 1333/A | 1951/PUB |
| SFR/D | 16607 | Falda AVE | $800,000 | $614 | 3/1,0,1,0 | 1304/A | 1952/ASR |
| SFR/D | 3232 W | 187th PL | $800,000 | $576 | 3/2,0,0,0 | 1389/A | 1950/ASR |
| SFR/D | 3407 W | 190th ST | $810,000 | $443 | 4/3,0,1,0 | 1828/O | 1951/SEE |
| SFR/D | 3231 W | 188th ST | $829,000 | $750 | 3/2,0,0,0 | 1106/A | 1950/ASR |
| SFR/D | 4122 W | 183rd ST | $890,000 | $578 | 4/3,0,0,0 | 1540/A | 1954/ASR |
| TWNHS/D | 18305 | Amie AVE | $900,000 | $441 | 4/3,1,0,0 | 2040/A | 2007/OTH |
| SFR/D | 16842 | Thornburgh AVE | $920,000 | $536 | 4/2,0,0,0 | 1716/A | 1953/ASR |
| SFR/D | 2735 W | 176th ST | $550,000 | $602 | 2/1,0,0,0 | 914/A | 1950/ASR |
| TWNHS/A | 18337 | Van Ness AVE | $635,000 | $390 | 4/2,0,1,0 | 1627/A | 1964/ASR |
| SFR/A | 2612 W | 176th ST | $715,000 | $699 | 3/1,0,0,0 | 1023/A | 1950/ASR |
| SFR/D | 2023 W | 162nd ST | $810,000 | $548 | 3/1,1,0,0 | 1479/A | 1951/ASR |
| SFR/D | 2509 W | 178th ST | $813,500 | $698 | 3/0,1,1,0 | 1166/A | 1955/ASR |
| SFR/D | 18031 | Gramercy PL | $840,000 | $625 | 3/2,0,1,0 | 1343/A | 1957/ASR |
| TWNHS/A | 17508 | Van Ness AVE | $915,000 | $515 | 3/2,0,2,0 | 1776/B | 2018/ASR |
| SFR/D | 2145 | Johnson CT | $990,000 | $540 | 4/2,0,0,0 | 1832/A | 1965/ASR |
| TWNHS/A | 911 | Cota AVE #4 | $580,000 | $436 | 2/1,1,1,0 | 1329/A | 1984/ASR |
| TWNHS/A | 2701 | Gramercy AVE #8 | $665,000 | $494 | 3/3,0,0,0 | 1345/A | 1984/ASR |
| TWNHS/A | 2701 | Gramercy AVE #2 | $672,000 | $500 | 3/2,0,1,0 | 1345/A | 1984/PUB |
| TWNHS/A | 2160 | Plaza Del Amo #175 | $674,000 | $444 | 3/1,1,1,0 | 1517/A | 1979/ASR |
| TWNHS/A | 2132 | Washington AVE | $705,000 | $511 | 2/2,0,1,0 | 1379/A | 2006/ASR |
| TWNHS/A | 807 | Van Ness AVE #D | $708,000 | $482 | 3/2,0,1,0 | 1470/A | 2000/ASR |
| TWNHS/D | 2112 | Santa Fe AVE | $713,000 | $405 | 3/2,0,1,0 | 1761/A | 1991/ASR |
| SFR/D | 1014 | Sierra PL | $715,000 | $594 | 2/1,0,1,0 | 1204/A | 1950/ASR |
| SFR/D | 2624 | Martha AVE | $725,000 | $724 | 2/2,0,0,0 | 1001/A | 1949/ASR |
| SFR/D | 812 | Portola AVE | $765,000 | $428 | 4/2,1,0,0 | 1786/A | 1920/ASR |
| TWNHS/A | 1800 | Oak ST #346 | $770,000 | $579 | 2/2,0,1,0 | 1330/A | 2007/ASR |
| SFR/D | 2024 | Gramercy AVE | $835,000 | $769 | 3/1,1,0,0 | 1086/A | 1917/ASR |
| TWNHS/A | 624 | Madrid AVE | $880,000 | $390 | 3/2,0,1,0 | 2256/A | 1990/ASR |
| TWNHS/A | 2303 | Jefferson ST #1200 | $910,000 | $376 | 3/3,0,1,0 | 2419/B | 2010/ASR |
| SFR/D | 1511 | Acacia AVE | $949,900 | $768 | 3/2,0,0,0 | 1237/A | 1927/ASR |
| TWNHS/A | 2200 W | 236th PL W | $650,000 | $594 | 2/3,0,0,0 | 1094/B | 2018/ASR |
| SFR/D | 1762 W | 244th ST | $725,000 | $580 | 3/2,0,0,0 | 1250/A | 1953/ASR |
| SFR/A | 2025 | Reynosa DR | $753,000 | $727 | 2/1,0,0,0 | 1036/A | 1947/APP |
| SFR/D | 1957 W | 235th PL | $850,000 | $564 | 4/2,0,0,0 | 1508/A | 1963/ASR |
| SFR/D | 2062 W | 234th ST | $1,130,000 | $451 | 4/3,0,0,0 | 2508/S | 1965/ASR |
| SFR/D | 1926 W | 237th PL | $1,188,000 | $364 | 4/5,0,0,0 | 3263/A | 1992/ASR |
Torrance Real Estate Market Snapshot for August
Here’s a quick overview of the real estate market in Torrance CA for August. It was a HUGE month with 122 home sales during the month which was equal to a several year high water market. Homes only averaged 24 days on the market before selling. The median home price was $877,000. View all of the homes that sold in Torrance during August.
View the current homes for sale in Torrance CA
Community Spotlight – SummerWind in the Plaza Del Amo area of Torrance
Welcome to the gated community of SummerWind in the heart of Torrance 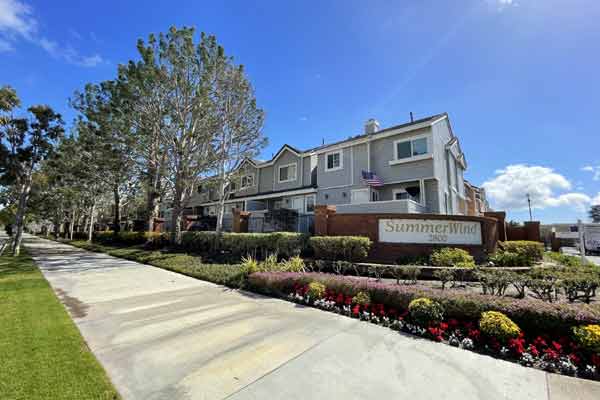
SummerWind is the largest of the gated communities in the Plaza Del Amo area of Torrance. This beautiful complex offers 508 individually owned townhome style attached units. Homes range between two bedroom/two bath home with between approximately 1,088 and 1,273 square feet and three bedroom/three bath units around 1,404 square feet (there are a very limited number of larger homes with approx 1,560 square feet. All of the homes offer 2 gar garages and laundry areas or rooms.
The community has a great look and feel with tree lined streets, water features, park areas scattered throughout and a good amount of space to roam around without ever leaving the complex. Although it was built in the late 80s, many of the units have been extensively updated and upgraded and look and feel much newer.
The communty offers an abundance of amenities including three recreation areas each with a pool and spa, community clubhouse, onsite manager, well maintained landscaping, and a playground area for the little ones and plenty of areas to walk the dogs or just sit in the sunshine.
As with all of the communities of Plaza Del Amo, Summer Wind is just a short distance to the newly rebuilt Del Amo fashion mall, Wilson Park with 2 farmers markets a week, The South Bay Galleria, shopping, dining, entertainment and more.
HOA dues are on the high side for the area at approximately $499** as of 7/28/24
Current SummerWind Homes for Sale
All information provided is deemed reliable, but is not guaranteed and should be independently verified.
*Square footage approximate based on information from the CRMLS and is not guaranteed.
**HOA fees approximate as of 7/28/20.
Vist some of the Gated communities and complexes near Plaza Del Amo
Q2 Market Stats – Torrance Real Estate At a Glance
Take a quick glance at the real estate stats for the 2nd quarter in Torrance. In Q2 there were 225 sales which was considerably lower than the 325 in the same span during 2019. The other numbers were impressive however….the median sales price for closed homes was $822,000 and days on market was only 26.
View all of the current homes for sale in Torrance
Torrance Market Update – Real Estate at a Glance
Torrance real estate is picking up after a few, somewhat, slower months. June 2020 saw 95 home sales which was the highest number of home sales since December. The 115 homes in escrow was a dramatic jump from the 46 pending sales in April due to coronavirus slowdown.
View the current homes for sale in Torrance CA
The chart below shows the past 15 months with the number of closed sales (dark green bar), pending home sales (red line) and the number of active listings (light green bar).
- « Previous Page
- 1
- …
- 13
- 14
- 15
- 16
- 17
- …
- 27
- Next Page »