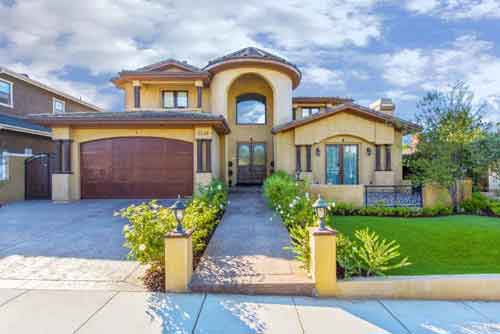
Community Spotlight – Oceanview Townhomes of Village Palos Verdes in the Hollywood Riviera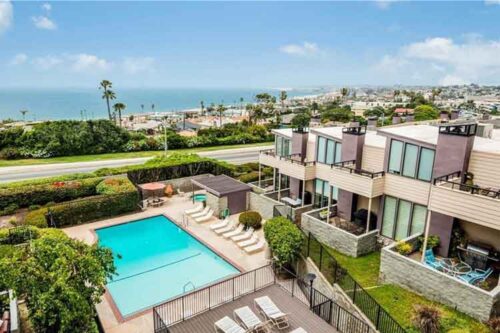
For many, an oceanview home in the Hollywood Riviera is unaffordable. One option may be Village Palos Verdes located just south of Palos Verdes drive. Not only do many of the townhomes have great ocean views but the location is ideal with the community just a short walk to Torrance beach and Paseo De La Playa. The complex consists of approximately 180 units with current HOA (as of 12/21) around $505 a month. The street addresses for the homes in Village Palos Verdes are either Calle Mayor, Calle Miramar, Camino De Las Colinas or Palos Verdes Blvd.
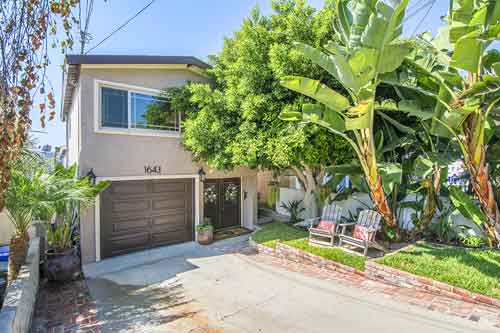
The homes are located very close to Riviera Village shopping and downtown areas and are just a few blocks to Torrance Beach (yes Torrance has a beach).
The homes are a combination of 2 and 3 bedrooms generally on 3 levels ranging between 1350 square feet and 1905 square feet. All have attached garages. The townhomes were built between 1974 and 1978 with some still having a fairly original feel and some being extensively remodeled. The community offers a pool and spa and is ideally located just a few blocks from the beach. Click here to see the current homes for sale in the Hollywood Riviera and Village Palos Verdes. For many years the concern about the community had been the large special assessment needed to update and renovate the exteriors from the original wood siding. Those changes took place several years ago and the community now has a wonderful look and feel.
Current homes for sale in Village Palos Verdes*
Any property information referenced on this website comes from the Internet Data Exchange (IDX) program of CRISNet MLS and/or CARETS. All data, including all measurements and calculations of area, is obtained from various sources and has not been, and will not be, verified by broker or MLS. All information should be independently reviewed and verified for accuracy. Properties may or may not be listed by the office/agent presenting the information.