By Keith Kyle
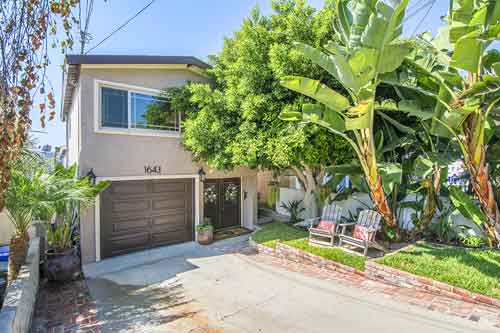
December was a pretty typical month in Torrance real estate with 112 home sales at a median price of $656,000. December traditionally is a much slower month but with the continued demand for Torrance homes, there doesn’t seem to be such a thing as a slow month. Click here to see the sold homes in Torrance for December. For the current homes for sale visit our active listings page.
| City | HomesSold | December2016 Median | December2015 Median | Yearover Year % Change% |
| Carson | 54 | $450,000 | $420,000 | 7% |
| El Segundo | 14 | $816,000 | $1,171,000 | -30.3% |
| Gardena | 44 | $504,000 | $413,000 | 22.1% |
| Harbor City | 9 | $523,000 | $404,000 | 29.5% |
| Hawthorne | 37 | $575,000 | $520,000 | 10.6% |
| Hermosa Beach | 17 | $1,380,000 | $1,625,000 | -15.1% |
| Lawndale real estate | 8 | $393,000 | $521,000 | -24.6% |
| Lomita | 6 | $473,000 | $535,000 | -11.6% |
| Long Beach | 298 | $490,000 | $435,000 | 12.6% |
| Manhattan Beach | 38 | $1,863,000 | $1,831,000 | 1.7% |
| Marina Del Rey | 21 | $955,000 | $945,000 | 1.1% |
| Palos Verdes Estates | 25 | $1,550,000 | $1,675,000 | -7.5% |
| Playa Del Rey | 20 | $658,000 | $612,000 | 7.5% |
| Rancho Palos Verdes | 47 | $1,088,000 | $945,000 | 15.1% |
| Redondo Beach | 75 | $900,000 | $855,000 | 5.3% |
| San Pedro | 58 | $515,000 | $485,000 | 6.3% |
| Torrance | 112 | $656,000 | $585,000 | 12.1% |
| Westchester | 32 | $943,000 | $892,000 | 5.7% |