• Home
  • FREE Email Listing Updates
  • Search for Homes
    • Search The MLS
    • Search All Torrance
    • Search By Map
    • West Torrance
    • Southwood
    • South Torrance
    • Hollywood Riviera
    • North Torrance
    • Old Torrance
    • Central Torrance
    • South East Torrance
    • Marble Estates
    • Walteria and Victoria Knolls
    • County Strip/ Harbor Gateway
    • Plaza Del Amo
    • Foreclosures
    • South Bay homes & real estate
  • Search by Price
    • Below $350,000
    • $350,000 – $450,000
    • $450,000 – $550,000
    • $550,000 – $650,000
    • $650,000 – $750,000
    • $750,000 – $850,000
    • $850,000 – $1,050,000
    • Above $1,050,000
  • Sellers
    • What is my Home Worth?
    • How We Sell
    • Quick Home Valuation
    • Recent Home Sales
    • Quick Valuation
  • Market News
  • About
    • Your Torrance Realtor
      • Client Testimonials
      • Vista Sotheby’s
      • Contact Us – Torrance Realtor Keith Kyle of Vista Sotheby’s
      • Search for Homes by Torrance Neighborhood
      • The Cities in the South Bay
      • Our Google+ Profile
      • Home Selling Process
    • Torrance Unified Schools – Great Schools Make for Great Neighborhoods
    • Recent Torrance Sales & Home Prices
    • Market Trends
      • Hollywood Riviera
      • West Torrance
      • Walteria
      • Old Torrance
      • North Torrance West
  • Neighborhoods
    • Torrance Schools
    • Neighborhood Map
    • West Torrance
    • Southwood
    • Hollywood Riviera
    • Walteria & Victoria Knolls
    • South Torrance
    • Old Torrance
    • North Torrance
    • Plaza Del Amo
    • Central Torrance
    • 55+ Senior Communities
    • Souoth Bay and Palos Verdes

Torrance real estate and homes for sale

Keith Kyle - Vista Sotheby's International

2021 Year in Review – Torrance Real Estate By the Numbers

January 17, 2022 by Keith Kyle

What a year it was for the real estate market in Torrance CA.  There were 1148 on MLS home sales and closed escrows during the year. The average “list” price was $1,032000 and the average “sold” price was an impressive $932,000.  Those numbers are a bit deceiving as there were a few ultra expensive homes that sold during the year and they sold dramatically below the list price which skewed the numbers just a bit.  Average price per foot was $636 and the average days on market was a brief 16 before going into pending status.
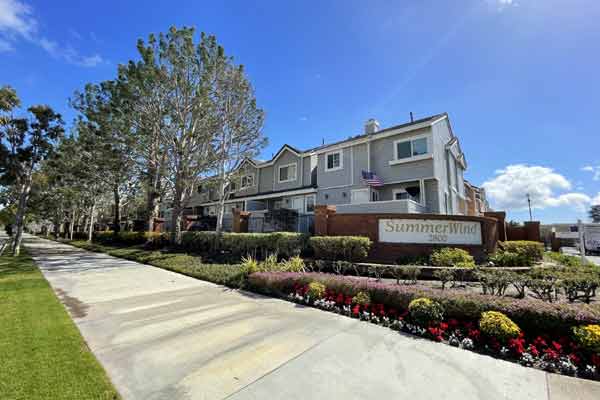
  • View the homes that sold in the Hollywood Riviera in 2021
  • View the homes that sold in Southwood
  • View the homes that sold in Plaza Del Amo
  • View the homes that sold in Old Torrance 2021

Filed Under: Hollywood Riviera homes 90277, Homes for Sale, Old Torrance, Plaza Del Amo, Southwood, Torrance home prices, Torrance homes for sale, Torrance Real Estate, Torrance Schools, West Torrance homes 90503 Tagged With: 2021 home prices in torrance, 2021 torrance home sales, hollywood riviera, plaza del amo, southwood homes torrance, torrance home prices, torrance home sales, torrance real estate, torrance real estate market, torrance realtors

Trackbacks

  1. 2021 Year in Review - West Torrance Real Estate Review – Torrance CA real estate and homes for sale says:
    January 17, 2022 at 10:29 pm

    […] What a year it was for home sales and home prices in the neighborhood of West Torrance 90503.  There were 114 on MLS homes that sold during 2o21.  The average “list” price was $1,112,991 with the average “sold” price at $1,174,751 meaning that homes generally sold WAY WAY over the asking price. The average price per foot was $703 with the average days on market a VERY brief 11 before going into pending status.   See the 2021 home sales in other Torrance neighborhoods. […]

  2. 2021 Year in Review - See the Homes that Sold in South Torrance 90505 – Torrance CA real estate and homes for sale says:
    January 17, 2022 at 10:36 pm

    […] What a year it was for home sales and home prices in the neighborhood of south Torrance 90505.  There were 94 on MLS homes that sold during 2o21.  The average “list” price was $1,178,161 with the average “sold price at $1,255,610 meaning that homes generally sold WAY WAY over the asking price. The average price per foot was $740 with the average days on market only 22 before going into pending status.   See the 2021 home sales in other Torrance neighborhoods. […]

  • FREE Listing Updates
  • What’s Your Home Worth?
  • Search Torrance CA Homes For Sale