• Home
  • FREE Email Listing Updates
  • Search for Homes
    • Search The MLS
    • Search By Map
    • Search by Zip Code
    • 55+ Senior Communities
    • Open Houses in Torrance
    • South Bay homes & real estate
  • Search by Neighborhood
    • All Torrance Listings
    • Old Torrance – 90501
    • West Torrance – 90503
    • South Torrance – 90505
    • Southwood – 90503
    • Central Torrance – 90503
    • Southeast Torrance – 90501 & 90505
    • North Torrance – 90504
    • Walteria and Victoria Knolls – 90505
    • Hollywood Riviera – 90277
    • Plaza Del Amo
    • Harbor Strip & Gateway – 90501
  • Search by Price
    • Below $450,000
    • $450,000 – $600,000
    • $600,000 – $750,000
    • $750,000-$900,000
    • $900,000-$1,100,000
    • $1,100,000-$1,250,000
    • $1,250,000-$1,500,000
    • Above $1,500,000
  • Sellers
    • What is my Home Worth?
    • How We Sell
    • Quick Home Valuation
    • Recent Torrance Property Prices
    • Quick Valuation
  • Market News
  • About
    • Neighborhoods
      • Torrance Schools
      • Neighborhood Map
      • West Torrance
      • Southwood
      • Hollywood Riviera
      • Walteria & Victoria Knolls
      • South Torrance
      • Old Torrance
      • North Torrance
      • Plaza Del Amo
      • Central Torrance
      • 55+ Senior Communities
      • South Bay and Palos Verdes
    • Your Torrance Realtor
      • Client Testimonials
      • Vista Sotheby’s
      • Contact Us – Torrance Realtor Keith Kyle of Vista Sotheby’s
      • Search for Homes by Torrance Neighborhood or Community Map
      • The Cities in the South Bay
      • Our Google+ Profile
      • Home Selling Process
    • Torrance Schools
    • Recent home sales and escrows
    • Market Trends
      • Hollywood Riviera
      • West Torrance
      • Walteria
      • Old Torrance
      • North Torrance West

Torrance real estate and homes for sale

Search for homes in Torrance CA

Home Sales & Median Home Prices in Torrance for August 2016

October 18, 2016 by Keith Kyle

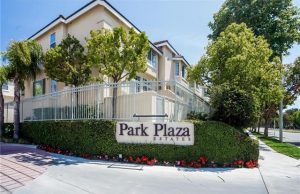
By Keith Kylepark-plaza-plaza-del-amo-sign

August 2016 saw another strong month for homes throughout the South Bay and Torrance.  Torrance, CA reached a 179 homes sold in the month of August with a median home price of $645,000.  As of October 18th 2016 there are 151 active homes and income properties for sale in Redondo Beach and 173 homes currently in escrow.  The lowest price of the month was a one bedroom condo in a 55+ building at $215,000 with the highest sale a $1,225,000 for a single family home in the Southwood community of Torrance.  Of all the homes sold only one was a short sale or foreclosure showing just how much of a non factor short sales are becoming in Torrance.   View the current homes for sale in Torrance, CA or view a list of the homes sold in Redondo Beach and the South Bay in August.

City Homes Sold August 2016 Median August 2015 Median Year over Year % Change%
Carson 56 $450,000 $430,000 4.7%
El Segundo 15 $1,075,000 $780,000 37.8%
Gardena 43 $470,000 $399,000 17.8%
Harbor City 24 $523,000 $450,000 16.1%
Hawthorne 47 $575,000 $493,000 16.8%
Hermosa Beach 22 $1,723,000 $1,389,000 24.%
Lawndale 16 $498,000 $437,000 13.8%
Lomita 23 $619,000 $510,000 21.4%
Long Beach 348 $463,000 $459,000 .8%
Manhattan Beach 36 $1,800,000 $1,923,000 -6.4%
Marina Del Rey 24 $1,059,000 $928,000 14.1%
Palos Verdes Estates 42 $1,412,000 $1,815,000 -22.2%
Playa Del Rey 16 $623,000 $560,000 11.2%
Rancho Palos Verdes 57 $1,065,000 $1,155,000 -7.8%
Redondo Beach 100 $968,000 $842,000 15%
San Pedro 70 $481,000 $475,000 1.3%
Torrance 179 $645,000 $585,000 10.3%
Westchester 44 $1,093,000 $890,000 22.7%

Filed Under: 55+ Homes in Torrance, Home Prices, Homes for Sale, Torrance CA real estate market, Torrance Real Estate Tagged With: palos verdes estate home prices, south bay home sales, south bay real estate, torrance home prices, torrance real estate

New Real Estate Website for the Hollywood Riviera

August 29, 2016 by Keith Kyle

We’ve created a new website geared specificially to the Hollywood Riviera area of Torrance. The Hollywood Rivera is one of our favorite areas in all of the South Bay with great views, proximity to the beach, ideal weather, a wonderful neighborhood feel, and somewhat restrictive building codes keeping the homes appropriate for the lot sizes and protecting the views.

To see real estate and homes for sale in the Hollywood Riviera visit out new real estate website.

Hollywood Riviera homes for sale.com

Filed Under: Hollywood Riviera homes 90277, Homes for Sale, Torrance Realtors Tagged With: hollywood riviera real estate, homes for sale in the hollywood riviera, torrance real estate

What makes the Torrance real estate market so unique in the South Bay?

August 6, 2016 by Keith Kyle

By Keith KyleTorrance homes for sale

People often think of the South Bay as one large market but each individual city can mean an entirely different real estate market….just take a look at the monthly median home prices in the South Bay as an indication.

Each city is it’s own real estate market but Torrance is different.  As Torrance is the largest city in the South Bay it’s also the most diverse.  That’s especially true in terms of real estate and home values in Torrance.

What make Torrance so different is the variety of areas, and the diversity of both the homes and the prices.  Torrance is a city that has multi million dollar homes along the Bluff on Paseo De La Playa and also has some of the most affordable homes in all of the South Bay.

Search Torrance homes by area.

The sheer size of Torrance also makes a difference.  Stretching all the way from the ocean to east of the 110 freeway makes for an abundance of options not possible in any other city in the area.  This also allows for everything from single family homes, to condos to even co-ops (rarely seen in the South Bay).

It is definitely not a seen one seen em all type real estate market.


Filed Under: Homes for Sale, Torrance CA real estate market, Torrance Real Estate, Torrance real estate trends Tagged With: keith kyle, torrance homes for sale, torrance real estate, torrance real estate market

Torrance Home Sales Up in May of 2016

July 6, 2016 by Keith Kyle

Torrance, CA saw a slight gain in year over year home prices in May with 138 homes sold this month at a median price of around $593,000 which was up from $579,000 the prior May.  138 homes is a very strong number for Torrance and shows that the market activity is continuing to pick up with more homes slowly coming on the market.  Click here to see the homes sold in Torrance for May of 2016.

City Homes
Sold
May
2016 Median
May
2015 Median
Year
over Year % Change%
Carson 57 $453,000 $410,000 10.4%
El Segundo 12 $802,500 $803,500 -.1%
Gardena 47 $425,000 $405,000 4.9%
Harbor City 26 $439,000 $415,000 5.8%
Hawthorne 39 $485,000 $525,000 -7.7%
Hermosa Beach 21 $1,285,000 $1,450,000 -11.4%
Lawndale 14 $455,000 $431,000 5.6%
Lomita 15 $488,000 $509,000 -4.1%
Long Beach 349 $485,000 $433,000 11.9%
Manhattan Beach 48 $1,875,000 $2,239,000 -16.2%
Marina Del Rey 31 $925,000 $918,000 .8%
Palos Verdes Estates 55 $1,499,000 $1,515,000 -1.1%
Playa Del Rey 24 $560,000 $615,000 -8.9%
Rancho Palos Verdes 58 $1,060,000 $1,100,000 -3.6%
Redondo Beach 96 $950,000 $845,000 12.5%
San Pedro 66 $489,000 $449,000 8.8%
Torrance 138 $593,000 $579,000 2.4%
Westchester 30 $1,130,000 $900,000 25.6%

Filed Under: Home Prices, Homes for Sale, Torrance CA real estate market, Torrance real estate trends Tagged With: home prices in torrance ca, homes for sale in torrance, torrance home sales, torrance real estate

March 2016 Median Home Prices for Torrance and the South Bay

May 24, 2016 by Keith Kyle

By Keith Kyle

The numbers for March are in and it was a big month for the number of homes sold in Torrance.  Torrance has been hovering a bit over 100 for the past few months but March saw 133 homes sell throughout this South Bay city.

City Homes
Sold
March
2016 Median
March
2015 Median
Year
over Year % Change%
Carson 54 $447,500 $426,500 4.9%
El Segundo 10 $1,006,000 $849,000 18.5%
Gardena 58 $475,000 $403,500 17.7%
Harbor City 14 $450,000 $455,000 -1.1%
Hawthorne 36 $513,000 $642,000 -20.2%
Hermosa Beach 16 $1,183,000 $1,310,000 -9.7%
Lawndale 10 $385,000 $447,000 -13.9%
Lomita 11 $530,000 $481,000 10.1%
Long Beach 327 $478,000 $414,000 15.3%
Manhattan Beach 41 $2,275,000 $1,940,000 17.3%
Marina Del Rey 18 $1,025,000 $860,000 19.2%
Palos Verdes Estates 28 $1,355,000 $1,400,000 -3.2%
Playa Del Rey 18 $560,000 $546,000 2.6%
Rancho Palos Verdes 56 $1,156,250 $1,044,500 10.7%
Redondo Beach 89 $893,000 $862,000 3.7%
San Pedro  80 $554,000 $481,000 15.1%
Torrance 133 $615,000 $530,000 16%
Westchester 25 $910,000 $854,000 6.6%

Filed Under: Home Prices, Homes for Sale, Redondo Beach, Torrance Real Estate Tagged With: home sales in torrance, homes sold in torrance, median home prices, torrance real estate

Torrance Median Home Prices for February 2016

April 24, 2016 by Keith Kyle

By Keith Kyle

Torrance, CA and the South Bay saw another strong month for home prices although a few cities saw big percentage drops in average home prices.  Those numbers, especially in smaller cities, or in a month with fewer home sales, don’t really mean much, but taken over times gives a good indication as to what is happening in the local Torrance real estate market.

Torrance had a slightly lower than average month with 85 home sales,with median home prices in the mid $500,000’s.

City Homes
Sold
February
2016 Median
February
2015 Median
Year
over Year % Change%
Carson 38 $420,000 $395,000 6.2%
El Segundo homes 11 $1,109,000 $815,000 36%
Gardena 38 $410,750 $334,000 23%
Harbor City 10 $527,500 $393,000 34.2%
Hawthorne homes for sale 30 $483,000 $450,000 7.4%
Hermosa Beach homes 17 $1,225,000 $1,512,500 -19%
Lawndale 8 $431,000 $415,000 3.9%
Lomita 11 %505,000 $326,000 55%
Long Beach 238 $461,000 $409,000 12.7%
Manhattan Beach real estate 22 $1,795,000 $2,361,000 -24%
Marina Del Rey 25 $864,000 $1,335,000 -35%
Palos Verdes Estates 33 $1,403,000 $1,300,000 7.9%
Playa Del Rey 10 $626,000 $710,750 6.9%
Rancho Palos Verdes 26 $1,110,000 $1,039,000 6.9%
Redondo Beach 45 $869,750 $812,000 7.1%
San Pedro 33 $505,000 $416,000 21.4%
Torrance 85 $565,000 $544,000 4%
Westchester 21 $917,000 $820,000 11.8%

Filed Under: Home Prices, Homes for Sale, Torrance Real Estate, Torrance Realtors Tagged With: home prices in torrance ca, median home prices, torrance real estate

  • « Previous Page
  • 1
  • …
  • 19
  • 20
  • 21
  • 22
  • 23
  • 24
  • Next Page »
  • FREE Listing Updates
  • What’s Your Home Worth?
  • Search Torrance CA Homes For Sale and Current Listings