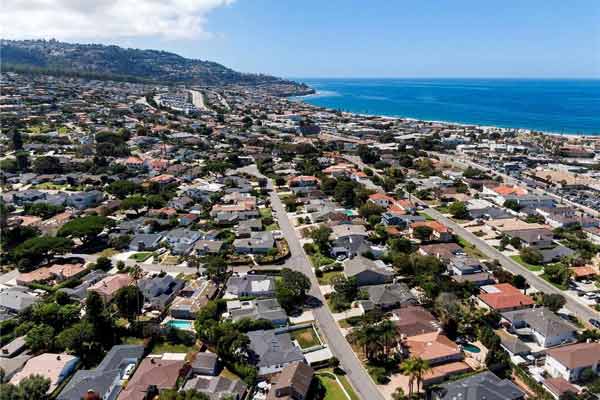
February was a slow month for closed home sales in Torrance Calfornia with only 71 homes sold during the month. That’s the fewest home sales in a month over the past 18 months other than December 2018 and 2019 (which is typically very slow) Prices were solid as they’ve been over the past 18 months with the median list prices of $717,500 and a median sales price of $700,000. Average price per foot for sold homes in Manhattan Beach was $532. Median days on market was only 13 which is incredibly low and is another indication of a strong sellers market. Old Torrance saw the most home sales with 10. See the Torrance real estate stats for the past 15 months below.
View the current homes for sale in Torrance CA
February 2020 Home Sales and Prices in Torrance.
| MLS # | Type | Address | Price | $ Per Foot | Bed/Bath | Sq Feet | Year | Sold Date | |
| DW19263303 | SFR/D | 1604 W | 226th ST | $510,000 | $675.50 | 2/1,0,0,0 | 755/A | 1952/ASR | 2/5/2020 |
| 20548890 | SFR | 21126 | Denker AVE | $580,000 | $591.23 | 2/1,0,0,0 | 981/O | 1952 | 2/26/2020 |
| PW19193695 | SFR/D | 1302 | Harmony WAY | $659,000 | $321.46 | 4/4,0,0,0 | 2050/A | 2007/ASR | 2/12/2020 |
| OC20014416 | SFR/D | 20951 | Halldale AVE | $795,000 | $519.61 | 4/2,0,0,0 | 1530/A | 1951/ASR | 2/21/2020 |
| SW19148442 | SFR/A | 21405 S | Normandie AVE | $978,990 | $364.89 | 4/4,0,0,0 | 2683/B | 2018/BLD | 2/21/2020 |
| SB20022832 | TWNHS/A | 22330 | Harbor Ridge LN #5 | $400,125 | $310.90 | 3/2,0,0,0 | 1287/A | 1980/ASR | 2/14/2020 |
| SB20015190 | CONDO/A | 22232 S | Vermont AVE #203 | $405,000 | $421.44 | 2/2,0,0,0 | 961/A | 1985/ASR | 2/27/2020 |
| RS19282196 | CONDO/A | 20553 S | Vermont AVE #1 | $420,000 | $433.88 | 2/0,2,0,0 | 968/A | 1982/ASR | 2/3/2020 |
| 19532922 | SFR | 21028 | Royal BLVD | $520,000 | $594.29 | 2/1,0,0,0 | 875/ | 1954 | 2/6/2020 |
| SB20014741 | SFR/D | 1012 | Clarion DR | $590,000 | $503.41 | 3/1,1,0,0 | 1172/A | 1959/ASR | 2/20/2020 |
| SB20014479 | SFR/D | 20809 | Orchard AVE | $613,000 | $523.04 | 3/2,0,0,0 | 1172/A | 1961/ASR | 2/5/2020 |
| OC20016855 | SFR/D | 912 W | 214th ST | $695,000 | $408.82 | 3/1,1,0,0 | 1700/A | 1960/ASR | 2/28/2020 |
| SB19273083 | SFR/D | 23329 | Berendo AVE | $800,000 | $300.98 | 5/1,2,0,0 | 2658/A | 1969/ASR | 2/11/2020 |
| SB20013550 | TWNHS/A | 3718 | Newton ST | $654,000 | $568.70 | 2/1,1,1,0 | 1150/A | 2010/ASR | 2/20/2020 |
| SB20002097 | SFR/D | 4006 W | 242nd ST | $840,000 | $889.83 | 2/1,0,0,0 | 944/A | 1949/ASR | 2/25/2020 |
| 19531970 | CONDO | 2605 | SEPULVEDA #201 | $455,000 | $458.21 | 1/1,0,1,0 | 993/ | 2003 | 2/5/2020 |
| SB19271335 | CONDO/A | 2605 | Sepulveda BLVD #208 | $510,000 | $428.21 | 2/1,1,0,0 | 1191/A | 2003/ASR | 2/27/2020 |
| SB20017286 | SFR/D | 2360 | Del Amo | $540,000 | $830.77 | 2/1,0,0,0 | 650/A | 1948/ASR | 2/21/2020 |
| SB19287069 | TWNHS/A | 3520 | Maricopa ST #22 | $626,000 | $453.62 | 2/1,1,1,0 | 1380/A | 1975/ASR | 2/11/2020 |
| PV20010588 | TWNHS/A | 2800 | Plaza Del Amo #368 | $665,000 | $561.18 | 2/2,0,1,0 | 1185/A | 1987/ASR | 2/12/2020 |
| SB20013809 | CONDO/A | 2563 | Plaza Del Amo #412 | $680,000 | $521.87 | 2/2,0,0,0 | 1303/A | 1985/ASR | 2/14/2020 |
| SB19281927 | TWNHS/A | 2300 | Maple AVE #58 | $781,800 | $454.27 | 3/2,0,1,0 | 1721/A | 1989/ASR | 2/13/2020 |
| 20543458 | TWNHS | 2300 | MAPLE AVE #232 | $845,000 | $452.60 | 4/3,0,0,0 | 1867/ | 1988 | 2/19/2020 |
| SB20008579 | SFR/D | 1017 | Teri AVE | $915,000 | $527.68 | 4/1,1,0,0 | 1734/A | 1951/ASR | 2/11/2020 |
| SB20001457 | TWNHS/D | 2889 | Plaza Del Amo #902 | $970,000 | $424.51 | 3/2,0,1,0 | 2285/A | 2003/ASR | 2/11/2020 |
| SB19225885 | CONDO/A | 3120 | Sepulveda BLVD #107 | $355,000 | $440.45 | 2/1,1,0,0 | 806/A | 2002/ASR | 2/21/2020 |
| SB19242404 | CONDO/A | 22841 | Nadine CIR #B | $417,500 | $373.77 | 2/1,1,0,0 | 1117/A | 1963/ASR | 2/6/2020 |
| SB20021449 | CONDO/A | 3120 | Sepulveda BLVD #209 | $420,000 | $521.09 | 2/2,0,0,0 | 806/A | 2002/ASR | 2/27/2020 |
| PW19211301 | CONDO/A | 22631 | Maple AVE #A | $464,000 | $488.42 | 2/1,0,1,0 | 950/A | 1963/ASR | 2/4/2020 |
| SB19132807 | CONDO/A | 22605 | Nadine Circle #200 | $485,000 | $501.55 | 2/1,0,1,0 | 967/P | 1963/PUB | 2/3/2020 |
| SB19282413 | CONDO/A | 22730 | Nadine CIR #A | $492,000 | $517.89 | 2/0,1,1,0 | 950/A | 1963/ASR | 2/21/2020 |
| SB19214876 | CONDO/A | 22939 | Nadine CIR #B | $510,000 | $456.58 | 2/2,0,0,0 | 1117/A | 1963/APP | 2/11/2020 |
| SB20025306 | SFR/D | 2759 W | 234th ST | $944,000 | $488.36 | 4/1,1,0,0 | 1933/A | 1965/ASR | 2/27/2020 |
| SB20006563 | SFR/D | 4621 | Greenmeadows AVE | $1,129,000 | $721.87 | 3/1,2,0,0 | 1564/A | 1953/ASR | 2/28/2020 |
| SB19250168 | SFR/D | 5418 | Calle De Arboles | $1,345,000 | $613.87 | 4/3,0,0,0 | 2191/A | 1955/ASR | 2/27/2020 |
| SB19242072 | SFR/D | 4111 | Paseo De Los Tortugas | $1,550,000 | $699.77 | 4/3,0,0,0 | 2215/A | 1968/ASR | 2/28/2020 |
| PV20021775 | SFR/D | 22644 | Gaycrest AVE | $878,000 | $1,068.13 | 2/1,0,0,0 | 822/A | 1952/ASR | 2/18/2020 |
| SB20016005 | SFR/D | 5035 | Avenue B | $989,000 | $506.66 | 3/2,0,0,0 | 1952/A | 1952/ASR | 2/21/2020 |
| OC19217903 | SFR/D | 22602 | Linda DR | $1,000,000 | $599.52 | 3/2,0,0,0 | 1668/A | 1952/APP | 2/12/2020 |
| PV20015739 | SFR/D | 3928 W | 234th PL | $1,075,000 | $514.35 | 4/2,0,0,0 | 2090/A | 1962/ASR | 2/27/2020 |
| PV20011715 | SFR/D | 23517 | Adolph AVE | $1,190,000 | $516.27 | 5/3,0,0,0 | 2305/A | 1962/ASR | 2/25/2020 |
| SB20003535 | SFR/D | 5024 | Macafee RD | $1,250,000 | $537.17 | 3/3,0,0,0 | 2327/A | 2000/ASR | 2/13/2020 |
| SB20011927 | SFR/D | 5020 | Laurette ST | $1,130,000 | $571.00 | 4/2,0,0,0 | 1979/A | 1955/ASR | 2/25/2020 |
| SB20015221 | SFR/D | 19413 | Donora AVE | $965,000 | $839.13 | 3/1,0,0,0 | 1150/A | 1955/ASR | 2/20/2020 |
| SB19147236 | SFR/D | 3713 W | 181st ST | $625,000 | $562.05 | 3/1,0,0,0 | 1112/A | 1953/PUB | 2/12/2020 |
| TR19191215 | SFR/D | 18603 | Crenshaw BLVD | $645,000 | $739.68 | 3/1,0,0,0 | 872/A | 1951/ASR | 2/12/2020 |
| SB19278883 | SFR/D | 18301 | Patronella AVE | $797,000 | $440.33 | 3/2,0,0,0 | 1810/A | 1954/ASR | 2/19/2020 |
| SB19259179 | SFR/D | 3806 W | 172nd ST | $875,000 | $570.03 | 3/2,0,0,0 | 1535/A | 1955/ASR | 2/10/2020 |
| SB20020606 | SFR/D | 17202 | Falda AVE | $880,000 | $425.33 | 3/2,0,0,0 | 2069/A | 1948/ASR | 2/26/2020 |
| DW19281919 | SFR/D | 18035 | Fonthill AVE | $926,000 | $315.07 | 5/4,0,0,0 | 2939/A | 1954/ASR | 2/25/2020 |
| SB20003030 | SFR/D | 3355 W | 175th ST | $940,000 | $505.38 | 3/2,0,0,0 | 1860/A | 1950/APP | 2/14/2020 |
| SB19227558 | SFR/D | 18808 | Van Ness AVE | $692,500 | $451.43 | 3/1,1,0,0 | 1534/A | 1951/ASR | 2/21/2020 |
| SB20008812 | SFR/D | 2055 W | 185th ST | $700,000 | $527.51 | 3/2,0,0,0 | 1327/A | 1955/ASR | 2/20/2020 |
| SB20000008 | SFR/D | 18151 | GRAMERCY PL | $779,000 | $641.15 | 3/1,1,0,0 | 1215/A | 1957/ASR | 2/28/2020 |
| SB19283904 | SFR/D | 2521 W | 168th ST | $810,000 | $537.49 | 3/2,0,0,0 | 1507/A | 1953/PUB | 2/11/2020 |
| DW19287241 | CONDO/A | 1281 | Cabrillo AVE #302 | $410,000 | $676.57 | 1/1,0,0,0 | 606/A | 1993/ASR | 2/28/2020 |
| PW19134808 | CONDO/A | 911 | Cota AVE #2 | $475,000 | $409.84 | 2/3,0,0,0 | 1159/A | 1984/APP | 2/21/2020 |
| SB20014462 | SFR/D | 2019 W | 220th ST | $587,500 | $807.01 | 2/1,0,0,0 | 728/A | 1930/PUB | 2/28/2020 |
| DW19267326 | SFR/D | 2418 | Del Amo BLVD | $625,000 | $686.81 | 3/1,0,0,0 | 910/A | 1948/ASR | 2/11/2020 |
| PW20001578 | TWNHS/A | 1833 | Cabrillo AVE | $690,000 | $575.00 | 2/2,0,1,0 | 1200/A | 2011/ASR | 2/13/2020 |
| SB20002581 | SFR/D | 617 | Cota AVE | $726,000 | $639.08 | 3/1,0,0,0 | 1136/A | 1919/ASR | 2/27/2020 |
| SB19264034 | SFR/D | 606 | Amapola AVE | $740,000 | $811.40 | 2/2,0,0,0 | 912/A | 1947/ASR | 2/5/2020 |
| SB20009557 | SFR/D | 2362 | Sierra ST | $818,000 | $464.77 | 3/2,0,1,0 | 1760/A | 1988/ASR | 2/21/2020 |
| SB19245968 | SFR/D | 1729 | Manuel AVE | $875,000 | $498.29 | 4/1,0,1,0 | 1756/A | 1950/ASR | 2/28/2020 |
| TR20005423 | SFR/D | 2405 | Santa Cruz CT | $986,300 | $377.03 | 4/3,0,0,0 | 2616/A | 1977/ASR | 2/19/2020 |
| CV19232342 | TWNHS/A | 23903 | Arlington AVE | $490,000 | $462.26 | 2/1,1,0,0 | 1060/A | 1978/ASR | 2/26/2020 |
| SB19257855 | CONDO/A | 23418 | Arlington AVE #1 | $540,000 | $385.44 | 3/1,1,0,1 | 1401/A | 1973/ASR | 2/24/2020 |
| SB20009491 | SFR/D | 2269 W | 233rd ST | $850,000 | $361.09 | 4/3,0,0,0 | 2354/A | 1978/ASR | 2/26/2020 |
| SB20008302 | SFR/D | 2338 W | 232nd ST W | $879,000 | $529.84 | 3/2,0,0,0 | 1659/A | 1973/ASR | 2/20/2020 |
| DW19216620 | CONDO/A | 20425 S | Vermont AVE #4 | $380,000 | $396.25 | 2/2,0,0,0 | 959/A | 1980/ASR | 2/14/2020 |
| PW19266283 | SFR/A | 1655 W | 216th ST | $740,000 | $508.24 | 4/2,0,0,0 | 1456/A | 1944/ASR | 2/7/2020 |
By the Number – Real Estate Stats for Torrance CA
 single family homes. The median list price for the closed sales was $1,200,000 with the median sales price of $1,177,500 indicating that it is still a solid seller’s market. That does seem to be shifting somewhat with the playing field leveling just a bit. The least expensive home sale during October was $820,000 for a 3 bedroom, 2 1/2 bath single family home at 4414 Highgrove and the most expenseive sale of the month was a Louis Tomaro designed home at
  the average sales price at $744,270. The median list price was $729,000 while the median sold price was at $715,875. The highest sale of the month was $1,750,000 for a 4 bedroom