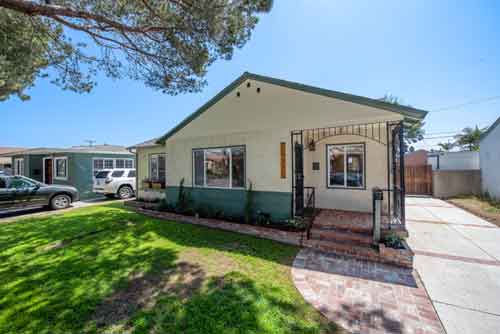
Welcome to the gated community of SummerWind in the heart of Torrance 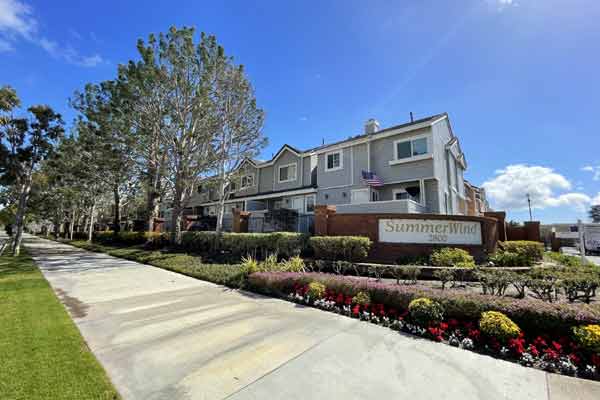
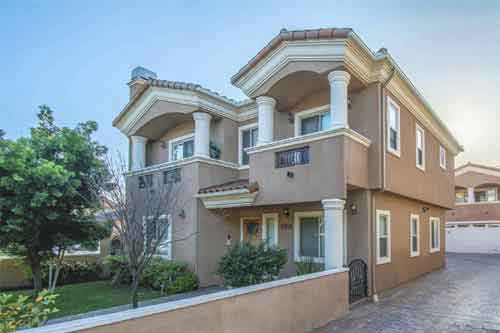
SummerWind is the largest of the gated communities in the Plaza Del Amo area of Torrance. This beautiful complex offers 508 individually owned townhome style attached units. Homes range between two bedroom/two bath home with between approximately 1,088 and 1,273 square feet and three bedroom/three bath units around 1,404 square feet (there are a very limited number of larger homes with approx 1,560 square feet. All of the homes offer 2 gar garages and laundry areas or rooms.
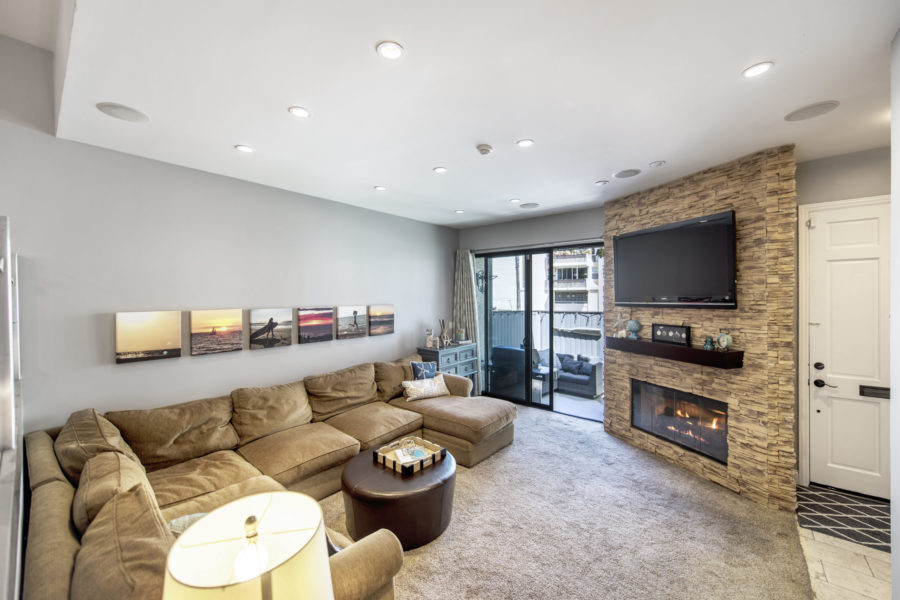
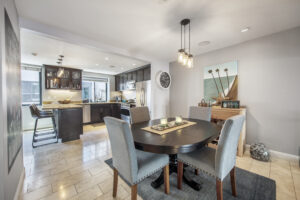
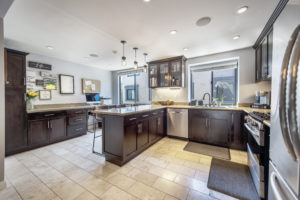
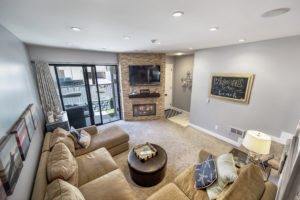
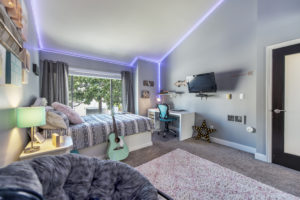
The community has a great look and feel with tree lined streets, water features, park areas scattered throughout and a good amount of space to roam around without ever leaving the complex. Although it was built in the late 80s, many of the units have been extensively updated and upgraded and look and feel much newer.
The communty offers an abundance of amenities including three recreation areas each with a pool and spa, community clubhouse, onsite manager, well maintained landscaping, and a playground area for the little ones and plenty of areas to walk the dogs or just sit in the sunshine.
As with all of the communities of Plaza Del Amo, Summer Wind is just a short distance to the newly rebuilt Del Amo fashion mall, Wilson Park with 2 farmers markets a week, The South Bay Galleria, shopping, dining, entertainment and more.
HOA dues are on the high side for the area at approximately $499** as of 7/28/24
Current SummerWind Homes for Sale
All information provided is deemed reliable, but is not guaranteed and should be independently verified.
*Square footage approximate based on information from the CRMLS and is not guaranteed.
**HOA fees approximate as of 7/28/20.

 a seller, knowing what the market is doing and where it appears to be heading can make all of the difference in the world. If we can be of assistance in any way please don’t hesitate to contact us. You can view these