• Home
  • FREE Email Listing Updates
  • Search for Homes
    • Search The MLS
    • Search By Map
    • Search by Zip Code
    • 55+ Senior Communities
    • Open Houses in Torrance
    • South Bay homes & real estate
  • Search by Neighborhood
    • All Torrance Listings
    • Old Torrance – 90501
    • West Torrance – 90503
    • South Torrance – 90505
    • Southwood – 90503
    • Central Torrance – 90503
    • Southeast Torrance – 90501 & 90505
    • North Torrance – 90504
    • Walteria and Victoria Knolls – 90505
    • Hollywood Riviera – 90277
    • Plaza Del Amo
    • Harbor Strip & Gateway – 90501
  • Search by Price
    • Below $450,000
    • $450,000 – $600,000
    • $600,000 – $750,000
    • $750,000-$900,000
    • $900,000-$1,100,000
    • $1,100,000-$1,250,000
    • $1,250,000-$1,500,000
    • Above $1,500,000
  • Sellers
    • What is my Home Worth?
    • How We Sell
    • Quick Home Valuation
    • Recent Torrance Property Prices
    • Quick Valuation
  • Market News
  • About
    • Neighborhoods
      • Torrance Schools
      • Neighborhood Map
      • West Torrance
      • Southwood
      • Hollywood Riviera
      • Walteria & Victoria Knolls
      • South Torrance
      • Old Torrance
      • North Torrance
      • Plaza Del Amo
      • Central Torrance
      • 55+ Senior Communities
      • South Bay and Palos Verdes
    • Your Torrance Realtor
      • Client Testimonials
      • Vista Sotheby’s
      • Contact Us – Torrance Realtor Keith Kyle of Vista Sotheby’s
      • Search for Homes by Torrance Neighborhood or Community Map
      • The Cities in the South Bay
      • Our Google+ Profile
      • Home Selling Process
    • Torrance Schools
    • Recent home sales and escrows
    • Market Trends
      • Hollywood Riviera
      • West Torrance
      • Walteria
      • Old Torrance
      • North Torrance West

Torrance real estate and homes for sale

Search for homes in Torrance CA

Pocket and Off Market Home Listings in Torrance CA

March 6, 2014 by Keith Kyle

By Keith Kyle

If you’re a home buyer at the moment, you’ve probably been a little frustrated with just how little housing inventory there is, how quickly the good homes sell, and how often they sell for far more than they were listed.  You’ve probably also heard the terms pocket listings and off market listings as those are definitely the buzz words of the moment.

So what do these words really mean and how do you find out about them?

Pocket listings and off market listings can mean several things, but basically they are homes that agents may, or may not, have formal agreements to sell, but are aware the sellers are interested in selling.  Most often the realtor has a written agreement to represent the sellers, but for one reason or another, the sellers either don’t want their home to be put on the MLS or perhaps they just aren’t quite ready.  In other situations it may be far more informal with either the homeowner telling a realtor “bring me a buyer and maybe I’ll sell” or something in which the owner would only consider selling at a price over the market value of the home.

So how does this help you?

The concept is pretty simple….the fewer buyers that know about a home the better the chances of having your offer considered and accepted.  Without the buyer frenzy that comes with most new listings these days the price may be kept at a reasonable level as well.

So how do you find these homes?

The best way to find these off market listings is to work with a successful local agent that specializes in the area you’re interested in.  It’s all about networking and the more owners, sellers and other agents the realtor is in contact with the more likely they may have ways of finding listings the public isn’t aware of.   Good agents will also actively seek out some unknown sellers with letters or even by door knocking.  Buyers can certainly try this on their own as well, but just won’t have the same reach as a well connected local agent.  If you would like us to help simply fill out our “let me know about pocket listings form” and specify if you want us to update you on all listings….or just the homes not on the market.

Be realistic

Although many deals are happening off market and it is a very good way of trying to find a home in a very challenging sellers market, buyers must be realistic.  Finding something off market generally doesn’t mean paying 70% of it’s value.  In our very high end market in which sellers have resources and information to know what their homes are worth, sellers are very savvy and often only willing to sell their homes off market if the price is right.
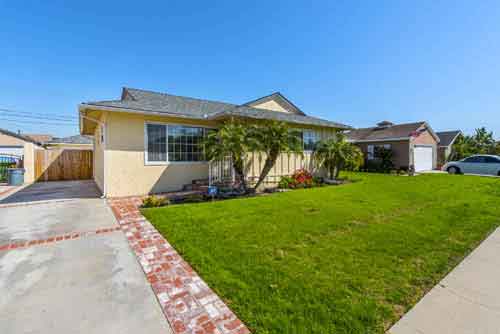
Filed Under: Buyers, First Time Buyers, Listing Agents, Pocket Listings, Sellers, Torrance CA real estate market, Torrance Real Estate, Torrance Realtors Tagged With: homes, homes for sale, local experts, off market, pocket listings, real estate, sellers market, torrance ca

North Torrance West Real Estate Statistics

March 4, 2014 by Keith Kyle

By Keith Kyle

As knowledge is critical in real estate, we hope that the information provided below will make the real estate market in the North West areas of Torrance easier to understand and the trends can make for educated decisions. Whether you are a buyer, or a seller, knowing what the market is doing and where it appears to be heading can make all of the difference in the world. If we can be of assistance in any way please don’t hesitate to contact us. You can view these trends for all Torrance CA neighborhoods.

View the current North Torrance – West Homes for Sale

The chart below shows the recent history of the number of active listings, pending home sales and closed escrows. The higher ratio of active to sold/pending listings shows a buyers market while lower inventory shows a sellers market.

The chart below shows the average price per square foot in North Torrance West. This includes all types of homes including condos, townhomes and single family homes

The chart below shows the percentage of sold price / list price at which an equal number of properties are sold above, equal or below the list price and it indicates how long it has taken to sell those properties.

The chart below shows the difference between the average price for sale in North Torrance and average price of the sold homes. It helps determine whether the market is a buyer or seller market. If the average listing price and average sold price are the closest, the area has the healthiest market.

The chart below shows the months of inventory for a particular month. As a rule of thumb, an inventory level of less than three indicates a strong seller market while an inventory level greater than six indicates a buyer’s market.


CURRENT NORTH TORRANCE WEST HOMES FOR SALE
[idx-listings community=”132 – N Torrance – West” statuses=”1″ orderby=”DateAdded” orderdir=”DESC” count=”25″ showlargerphotos=”true” listtabalignment=”Left”]

Filed Under: Buyers, North Torrance West, Torrance CA real estate market, Torrance Real Estate, Torrance real estate trends Tagged With: active home listings, days on market, market statistics, market trends, north torrance, pending sales, prices, real estate, sold homes

Old Torrance Real Estate Trends and Statistics

March 4, 2014 by Keith Kyle

When buying or selling homes in Torrance, knowing and understanding the real estate market is critical to making the right decision.  Real estate trends can help determine current values or even when the appropriate time to list and sell your Torrance home. The information below is intended to help you get a better understanding of what is happening in the market.

Number of active listings (light green) sold homes (dark green) and pending home sales (red line) 

The greater the discrepancy between active homes and sold homes indicates a buyers market and when the numbers are closer a sellers market is indicated as inventory is down.

Average price per square foot.

Square footage in the South Bay often doesn’t mean as much as in other markets as values can vary so dramatically due to things such as proximity to the beach, views, specific neighborhoods.

Average days on market per month as well as the % of list price that homes sold at. 

A high % indicates a sellers market as home sell at, or above list price.

Average price for listed home sales in relation to the average price for sold homes.

Months of home inventory based on closed home sales. 

Buyer’s market: more than 6 months of inventory  Seller’s market: less than 3 months of inventory  Neutral market: 3 – 6 months of  inventory

Filed Under: Old Torrance, Torrance CA real estate market, Torrance real estate trends Tagged With: 90501, active listings, days on market, home prices, homes for sale, old torrance, pending home sales, real estate, sold homes, torrance ca

Walteria and Victoria Knolls Torrance Real Estate Market Trends

January 29, 2014 by Keith Kyle

When buying or selling homes in the Walteria and Victoria Knolls neighborhoods of Torrance, knowing and understanding the real estate market is critical to making the right decision. Real estate trends can help determine current values or even when the appropriate time to list and sell your  home. The information below is intended to help you get a better understanding of what is happening in the market. Sitting just east of the Hollywood Riviera and South Torrance, Walteria is a very community oriented area with most homes within walking distance to local schools, homes with appropriate sized lots and tree lined streets.  To see the actual prices and homes sold in Torrance last month visit our recent home sales page.

  • View the current homes for sale in Torrance
  • View the Victoria Knolls and Walteria Torrance homes for sale

The chart below shows the number of active listings (light green) sold homes (dark green) and pending home sales (red line) The greater the discrepancy between active homes and sold homes indicates a buyers market and when the numbers are closer a sellers market is indicated as inventory is down.

The chart below shows the average price per square foot. Square footage in the South Bay often doesn’t mean as much as in other markets as values can vary so dramatically due to things such as proximity to the beach, views, specific neighborhoods.

The chart below shows the average days on market per month as well as the % of list price that homes sold at. A high % indicates a sellers market as home sell at, or above list price.

The chart below shows the average price for listed home sales in relation to the average price for sold homes.

The chart below indicates the months of home inventory based on closed home sales. Buyer’s market: more than 6 months of inventory Seller’s market: less than 3 months of inventory Neutral market: 3 – 6 months of inventory

Filed Under: Buyers, Sellers, Torrance CA real estate market, Torrance Real Estate, Torrance real estate trends, Victoria Knolls, Walteria Tagged With: days on market, homes for sale, new listings, pending home sales, real estate, sale prices, torrance, victoria knolls, walteria

Real Estate Market Trends for Southwood Torrance

January 29, 2014 by Keith Kyle

When buying or selling homes in the Southwood neighborhood of Torrance, knowing and understanding the real estate market is critical to making the right decision. Real estate trends can help determine current values or even when the appropriate time to list and sell your Southwood home. The information below is intended to help you get a better understanding of what is happening in the market.  Sitting just east of Redondo Beach and in between the Torrance neighborhoods of South Torrance and West Torrance, Southwood is a very community oriented area with most homes within walking distance to local schools, homes with appropriate sized lots and tree lined streets.

The chart below shows the number of active listings (light green) sold homes (dark green) and pending home sales (red line) The greater the discrepancy between active homes and sold homes indicates a buyers market and when the numbers are closer a sellers market is indicated as inventory is down.

The chart below shows the average price per square foot. Square footage in the South Bay often doesn’t mean as much as in other markets as values can vary so dramatically due to things such as proximity to the beach, views, specific neighborhoods.

The chart below shows the average days on market per month as well as the % of list price that homes sold at. A high % indicates a sellers market as home sell at, or above list price.

The chart below shows the average price for listed home sales in relation to the average price for sold homes.

The chart below indicates the months of home inventory based on closed home sales. Buyer’s market: more than 6 months of inventory Seller’s market: less than 3 months of inventory Neutral market: 3 – 6 months of inventory

Filed Under: Buyers, Sellers, Southwood, Torrance CA real estate market, Torrance Real Estate, Torrance real estate trends Tagged With: days on market, home listings, homes for sale, market trends, real estate, southwood, torrance, west torrance

Real Estate Market Trends in South Torrance

January 26, 2014 by Keith Kyle

When buying or selling homes in South Torrance, knowing and understanding the real estate market is critical to making the right decision. Real estate trends can help determine current values or even when the appropriate time to list and sell your South Torrance home. The information below is intended to help you get a better understanding of what is happening in the market.

The chart below shows the number of active listings (light green) sold homes (dark green) and pending home sales (red line) The greater the discrepancy between active homes and sold homes indicates a buyers market and when the numbers are closer a sellers market is indicated as inventory is down.

The chart below shows the average price per square foot. Square footage in the South Bay often doesn’t mean as much as in other markets as values can vary so dramatically due to things such as proximity to the beach, views, specific neighborhoods.

The chart below shows the average days on market per month as well as the % of list price that homes sold at. A high % indicates a sellers market as home sell at, or above list price.

The chart below shows the average price for listed home sales in relation to the average price for sold homes.

The chart below indicates the months of home inventory based on closed home sales. Buyer’s market: more than 6 months of inventory Seller’s market: less than 3 months of inventory Neutral market: 3 – 6 months of inventory

Filed Under: Buyers, Torrance CA real estate market, Torrance Real Estate, Torrance real estate trends Tagged With: 90505, active listings, real estate, recent home sales, search for homes, south torrance homes, south torrance real estate

  • « Previous Page
  • 1
  • 2
  • 3
  • 4
  • Next Page »
  • FREE Listing Updates
  • What’s Your Home Worth?
  • Search Torrance CA Homes For Sale and Current Listings