Information is key to making sound real estate decisions. The information below should help you keep up with the market and provide valuable insight into where the market currently is and where it’s going in the future. See below for updated information such as number of active homes, pending sale, recent closed home sales and home prices for Torrance, Manhattan Beach, Hermosa Beach and Redondo Beach
New Listings
Active Listings
Pending Sales
Closed Sales
Days on Market
Price Per Foot
Average Sales Price
August 2017 Home Sales and Home Prices for Torrance CA
Torrance saw a nice jump in home sales with a 154 recorded property sales for August of 2017. Overall the South Bay 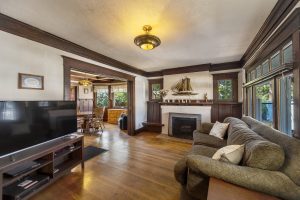 trended up from the previous year in terms of median home prices with only a few local cities seeing a decrease in y over year prices.
Torrance saw a median home price of just under $700,000 and the numbers continue to trend upward. To see all of the home sales in Torrance and the cities below visit our recent home sales page.
| City | Homes Sold |
August 2017 Median |
August 2016 Median |
Year over Year % Change% |
| Carson | 52 | $470,000 | $450,000 | 4.3% |
| El Segundo | 15 | $1,235,000 | $1,075,000 | 14.9% |
| Gardena | 53 | $495,000 | $472,000 | 4.9% |
| Harbor City | 20 | $521,000 | $522,000 | -.2% |
| Hawthorne | 45 | $583,000 | $575,000 | 1.4% |
| Hermosa Beach | 22 | $1,358,000 | $1,723,000 | 21.2% |
| Lawndale | 17 | $460,000 | $498,000 | -7.5% |
| Lomita | 19 | $610,000 | $619,000 | -1.5% |
| Long Beach | 404 | $490,000 | $463,000 | 5.9% |
| Manhattan Beach | 36 | $2,230,000 | $1,815,000 | 22.9% |
| Marina Del Rey | 37 | $940,000 | $1,059,000 | -11.2% |
| Palos Verdes Estates | 37 | $1,545,000 | $1,413,000 | 9.4% |
| Playa Del Rey | 27 | $625,000 | $623,000 | .3% |
| Rancho Palos Verdes | 60 | $1,088,000 | $1,065,000 | 2.2% |
| Redondo Beach | 118 | $975,000 | $969,000 | .6% |
| San Pedro | 78 | $572,000 | $481,000 | 19% |
| Torrance | 154 | $698,000 | $645,000 | 8.2% |
| Westchester | 50 | $1,180,000 | $1,093,000 | 8% |
Torrance Median Home Prices Up in July
What a month it was for home sales in Torrance and the South Bay. Double digit year over year changes were the 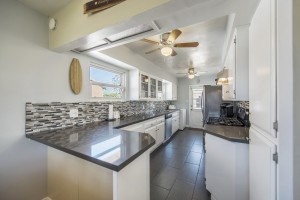 norm but there was really no sense to it with some cities seeing major increases over June of 2016 and some seeing just as major drops in home prices.
Real estate in Torrance CA was no different with another double digit jump for the median home prices compared with July of 2016. Torrance was actually a bit more moderate than other areas but still saw 113 homes close escrow in July with a median home price of just under $687,000 Click here to see the recent home sales in Torrance and the South Bay.
| City | Homes Sold | July 2017 Median | July 2016 Median | Year over Year % Change% |
| Carson | 60 | $480,000 | $445,000 | 8% |
| El Segundo | 20 | $1,055,000 | $1,310,000 | -19.5% |
| Gardena | 65 | $549,000 | $454,000 | 21% |
| Harbor City | 15 | $439,000 | $550,000 | -20.2% |
| Hawthorne | 35 | $730,000 | $562,000 | 30% |
| Hermosa Beach | 19 | $2,025,000 | $1,410,000 | 43.6% |
| Lawndale | 15 | $515,000 | $430,000 | 19.8% |
| Lomita | 21 | $598,000 | $585,000 | 2.1% |
| Long Beach | 331 | $520,000 | $471,500 | 10.3% |
| Manhattan Beach | 48 | $2,449,000 | $2,200,000 | 11.3% |
| Marina Del Rey | 36 | $921,000 | $974,000 | -5.4% |
| Palos Verdes Estates | 28 | $1558,000 | $1,800,000 | -13.4% |
| Playa Del Rey | 20 | $613,000 | $629,000 | -2.5% |
| Rancho Palos Verdes | 63 | $1,345,000 | $1,160,000 | 15.9% |
| Redondo Beach | 95 | $975,000 | $920,000 | 6% |
| San Pedro | 63 | $542,000 | $542,000 | 0% |
| Torrance | 113 | $687,000 | $617,000 | 11.4% |
| Westchester | 33 | $1,185,000 | $1,116,000 | 6.2% |
Torrance Home Sales and Median Home Prices for June 2017
June was a big month for home sales in Torrance CA with a fairly huge number of homes selling. The summer months are always an active market and this year was no different with 184 homes selling.. Thats well above the normal number of Torrance homes selling in a month. Median home prices were up just a bit over June of the previous year with the median home in Torrance selling at $673,000. Click here to track all of the important real estate trends for Torrance CA.
| City | Homes Sold | June 2017 Median | June 2016 Median | Year over Year % Change% |
| Carson | 61 | $445,000 | $450,000 | -1.1% |
| El Segundo | 15 | $800,000 | $1,135,000 | -29% |
| Gardena | 70 | $461,000 | $430,000 | 7.2% |
| Harbor City | 19 | $465,000 | $547,000 | -15% |
| Hawthorne | 45 | $592,000 | $624,000 | -5.1% |
| Hermosa Beach | 26 | $1,718,000 | $1,274,500 | 34.8 |
| Lawndale | 12 | $535,000 | $519,000 | 3.1% |
| Lomita | 18 | $565,000 | $555,000 | 1.8% |
| Long Beach | 419 | $523,000 | $470,000 | 11.2% |
| Manhattan Beach | 57 | $2,467,000 | $1,924,000 | 28.2% |
| Marina Del Rey | 34 | $968,000 | $900,000 | 7.6% |
| Palos Verdes Estates | 46 | $1,679,000 | $1,533,000 | 9.5% |
| Playa Del Rey | 34 | $683,000 | $603,000 | 13.3% |
| Rancho Palos Verdes | 75 | $1,240,000 | $1,200,000 | 3.3% |
| Redondo Beach | 117 | $969,000 | $945,000 | 2.5% |
| San Pedro | 82 | $510,000 | $500,000 | 1.9% |
| Torrance | 184 | $673,000 | $635,000 | 5.9% |
| Westchester | 42 | $1,090,000 | $1,050,000 | 3.8% |
See Torrance CA Home Prices for May 2017
Torrance saw a big increase in the monthly number of home sales in May 2017 with 140 homes closing escrow. The median home price was an impressive $690,000 for the month. See the Torrance CA real estate market trends and statistics here. To see the homes that sold in Torrance CA for May visit our home sales page.
| City | Homes Sold |
May 2017 Median | May 2016 Median | Year over Year % Change% |
| Carson | 41 | $458,000 | $453,000 | 1.2% |
| El Segundo | 8 | $880,000 | $803,000 | 9.7% |
| Gardena | 65 | $523,000 | $425,000 | 23.1% |
| Harbor City | 14 | $503,000 | $439,000 | 14.5% |
| Hawthorne | 46 | $610,000 | $485,000 | 25.8% |
| Hermosa Beach | 26 | $1,738,000 | $1,285,000 | 35.3% |
| Lawndale | 16 | $485,000 | $455,000 | 6.5% |
| Lomita | 18 | $653,000 | $488,000 | 33.7% |
| Long Beach | 356 | $472,000 | $485,000 | -2.6% |
| Manhattan Beach | 46 | $2,175,000 | $1,875,000 | 16% |
| Marina Del Rey | 32 | $933,000 | $925,000 | 0.8% |
| Palos Verdes Estates | 47 | $1,650,000 | $1,499,000 | 10.1% |
| Playa Del Rey | 31 | $720,000 | $560,000 | 28.6% |
| Rancho Palos Verdes | 51 | $1,275,000 | $1,060,000 | 20.3% |
| Redondo Beach | 87 | $1,054,000 | $950,000 | 10.9% |
| San Pedro | 63 | $620,000 | $489,000 | 26.8% |
| Torrance | 140 | $690,000 | $593,000 | 16.4% |
| Westchester | 44 | $965,000 | $1,130,000 | -14.6% |
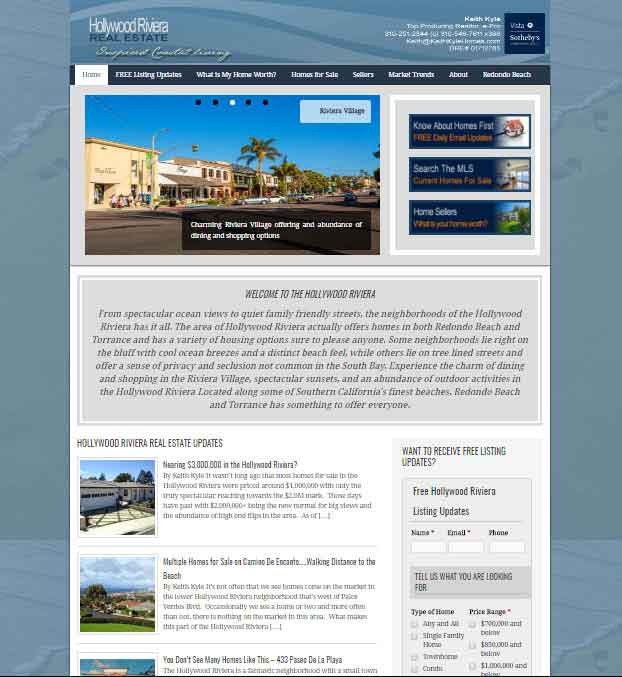
New Real Estate Website for Home Buyers and Sellers in the Hollywood Riviera
With the individual real estate markets in the South Bay being so diverse and specialized, the larger real estate sites and portals just can’t focus on specific neighborhoods. We are proud to announce the Hollywood Riviera real estate website www.HomesinHollywoodRiviera.com which will provide home buyers and sellers insight into this localized market. From the current homes for sale and MLS listings, to determining the value of homes in the area, to finding realtors that specialize in the real estate market of the Hollywood Riviera, we hope the site is an invaluable resource for all things real estate in this wonderful coastal community.
- Search for new listings and homes for sale in the Hollywood Riviera
- What is your Hollywood Riviera home worth? Find the value in todays market
- Create a customized search and receive updates when new homes hit the market
- See recent sales in the area
- « Previous Page
- 1
- …
- 18
- 19
- 20
- 21
- 22
- …
- 25
- Next Page »