October was another solid month for home sales in Torrance with 112 home sales. The average listing price for the month was $748,206 with the average sales price at $744,270. The median list price was $729,000 while the median sold price was at $715,875. The highest sale of the month was $1,750,000 for a 4 bedroom home in South Torrance in the Seaside Ranchos neighborhood at 5006 Sharynne and the lowest priced sale was a condo at $265,000.
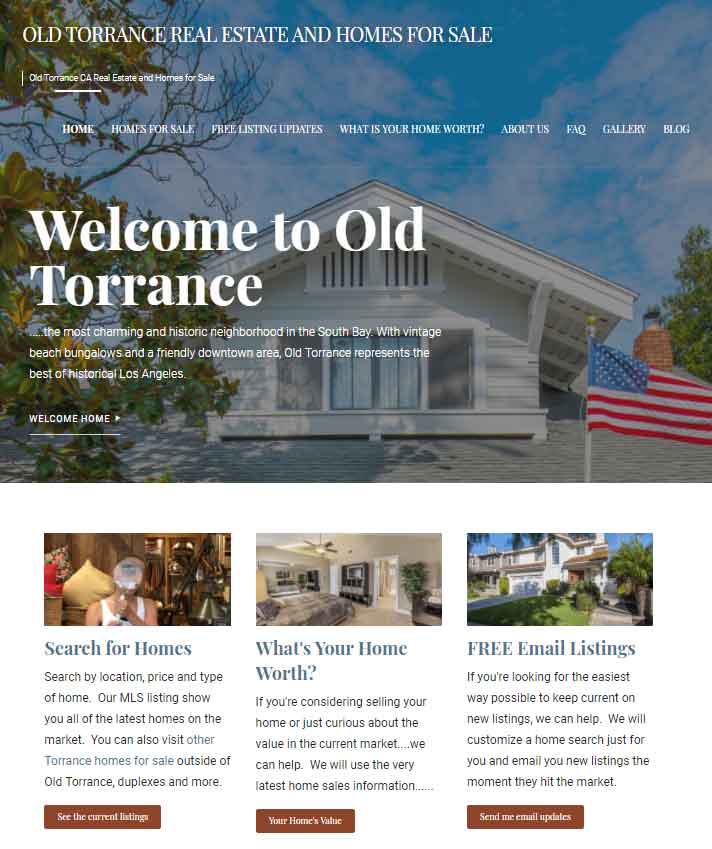
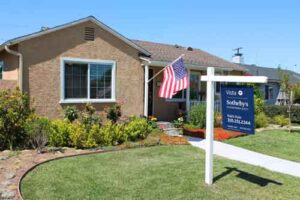
See the current homes for sale in Torrance CA
October 2018 Torrance Home Sales
| Type |
|
Sq Feet | |||||
| SFR/D |
1554 W
|
220th ST | $ 479,000 | $ 665.28 |
1/1,0,0,0 | 720/A | 1924/ASR |
| SFR/D |
1626 W
|
214th ST | $525,000 | $ 713.32 |
2/1,0,0,0 | 736/A | 1951/ASR |
| SFR/D |
1456 W
|
223rd ST | $580,200 | $ 499.31 |
3/2,0,0,0 | 1162/A | 1944/ASR |
| SFR/D |
1527 W
|
213th ST | $585,000 | $ 565.76 |
2/2,0,0,0 | 1034/A | 1940/ASR |
| SFR/A |
1306 W
|
214th ST | $600,000 | $ 364.08 |
3/2,0,1,0 | 1648/A | 1959/PUB |
| CONDO/A |
1133
|
Sepulveda Blvd #202 | $340,000 | $ 427.14 |
2/1,0,0,0 | 796/A | 1973/ASR |
| CONDO/A |
1127
|
Sepulveda Blvd #L104 | $350,000 | $ 408.88 |
2/2,0,0,0 | 856/A | 1973/APP |
| CONDO/A |
20565 S
|
Vermont AVE #8 | $390,000 | $ 402.89 |
2/2,0,0,0 | 968/A | 1982/ASR |
| CONDO/A |
23314
|
Marigold AVE #S101 | $425,000 | $ 398.69 |
3/2,0,0,0 | 1066/A | 1973/ASR |
| CONDO/A |
22912 S
|
Vermont AVE #4 | $445,000 | $ 399.82 |
3/2,0,0,0 | 1113/A | 1973/ASR |
| CONDO/A |
22919
|
Mariposa AVE #801 | $450,000 | $ 381.36 |
2/1,1,1,0 | 1180/A | 2009/ASR |
| CONDO/A |
874 W
|
232nd ST | $475,000 | $ 348.50 |
3/2,0,0,0 | 1363/A | 1974/ASR |
| SFR/D |
22922
|
Doble AVE | $540,000 | $ 534.65 |
3/1,0,0,0 | 1010/A | 1953/ASR |
| SFR/A |
22912
|
Doble AVE | $575,000 | $ 429.10 |
4/2,0,0,0 | 1340/A | 1953/ASR |
| SFR/D |
21141
|
Broadwell AVE | $605,000 | $ 376.48 |
3/2,0,0,0 | 1607/A | 1954/ASR |
| SFR/D |
20963 S
|
Van Deene AVE | $615,000 | $ 488.10 |
3/2,0,0,0 | 1260/A | 1957/ASR |
| SFR/D |
808
|
Gian DR | $649,000 | $ 409.21 |
4/2,0,0,0 | 1586/A | 1968/ASR |
| SFR/D |
719 W
|
226th ST | $651,000 | $ 269.34 |
4/3,0,0,0 | 2417/A | 1968/ASR |
| SFR/D |
21430
|
Marigold AVE | $665,000 | $ 358.88 |
3/2,0,0,0 | 1853/A | 1959/ASR |
| CONDO/A |
24452
|
Ward ST | $700,000 | $ 510.95 |
3/1,1,0,0 | 1370/A | 1981/ASR |
| SFR/D |
3322
|
Dalemead ST | $750,055 | $ 702.96 |
3/1,0,0,0 | 1067/A | 1950/ASR |
| SFR/D |
3213
|
Dalemead ST | $840,000 | $ 787.25 |
3/1,1,0,0 | 1067/T | 1950/ASR |
| DPLX/D |
24240
|
Ocean AVE | $900,000 | $ 348.70 |
9/4,1,0,0 | 2581/A | 1955/ASR |
| SFR/D |
3200
|
Newton ST | $1,020,000 |
$ 447.37 |
4/2,0,1,0 | 2280/B | 1993/ASR |
| SFR/D |
2849
|
Windmill RD | $1,059,000 |
$ 511.10 |
4/2,0,0,0 | 2072/A | 1975/ASR |
| SFR/D |
25932
|
Richville DR | $1,305,000 |
$ 446.00 |
4/2,0,1,0 | 2926/A | 1956/ASR |
| COOP/A |
3110
|
Merrill DR #85 | $477,900 | $ 367.62 |
2/1,1,0,0 | 1300/E | 1964/ASR |
| COOP/A |
3210
|
Merrill DR #32 | $480,000 | $ 342.86 |
3/1,1,0,0 | 1400/A | 1963/ASR |
| CONDO/A |
2567
|
Plaza Del Amo#308 | $500,000 | $ 574.71 |
1/1,0,1,0 | 870/A | 1985/ASR |
| CONDO |
3520
|
Maricopa ST #5 | $520,000 | $ 389.22 |
2/2,0,1,0 | 1336/A | 1975 |
| TWNHS/A |
2800
|
Plaza Del Amo #266 | $655,000 | $ 514.53 |
2/3,0,0,0 | 1273/A | 1988/ASR |
| TWNHS/A |
3508
|
Del Amo Bl | $700,000 | $ 422.45 |
4/3,0,0,0 | 1657/A | 1974/BLD |
| TWNHS/A |
2300
|
Maple AVE #231 | $780,000 | $ 417.78 |
4/3,0,0,0 | 1867/A | 1987/ASR |
| TWNHS/A |
4312
|
Spencer ST | $880,000 | $ 359.77 |
3/2,2,1,0 | 2446/A | 1989/PUB |
| SFR/D |
902
|
Cerise AVE | $892,000 | $ 527.19 |
3/2,0,0,0 | 1692/A | 1951/ASR |
| SFR/D |
2623
|
Bayport DR | $940,000 | $ 370.96 |
4/2,0,1,0 | 2534/A | 1987/ASR |
| SFR/D |
3708
|
Michelle DR | $950,000 | $ 436.98 |
4/3,0,0,0 | 2174/A | 1969/ASR |
| CONDO/A |
24410
|
Crenshaw Bl #211 | $265,000 | $ 356.66 |
1/1,0,0,0 | 743/A | 1987/ASR |
| CONDO/A |
22911
|
Nadine CIR #A | $480,500 | $ 430.17 |
2/2,0,0,0 | 1117/A | 1963/ASR |
| CONDO/A |
23053
|
Nadine CIR #A | $510,500 | $ 457.03 |
2/2,0,0,0 | 1117/A | 1963/ASR |
| CONDO/A |
22927
|
Maple AVE | $544,250 | $ 562.82 |
2/2,0,0,0 | 967/A | 1963/ASR |
| TWNHS/A |
2992 W
|
235th ST | $730,000 | $ 450.34 |
3/3,0,0,0 | 1621/A | 2000/ASR |
| SFR/D |
3735 W
|
226th ST | $790,000 | $ 714.29 |
3/1,1,0,0 | 1106/A | 1953/ASR |
| SFR/D |
22715
|
Eriel AVE | $952,702 | $ 496.46 |
4/2,0,0,0 | 1919/A | 1960/ASR |
| SFR/D |
4521
|
Greenmeadows AVE | $ 1,090,000 |
$ 699.61 |
3/1,0,1,0 | 1558/A | 1953/ASR |
| SFR/D |
4625
|
Paseo De Las Tortugas | $ 1,295,000 |
$ 810.39 |
3/1,1,0,0 | 1598/A | 1956/ASR |
| CONDO/A |
3970
|
Sepulveda Blvd #206 | $620,000 | $ 413.33 |
2/2,0,0,0 | 1500/B | 2007/ASR |
| SFR/D |
22939
|
Ocean AVE | $820,000 | $ 554.43 |
3/2,0,0,0 | 1479/A | 1955/ASR |
| CONDO/A |
22485
|
Kent AVE | $839,000 | $ 406.89 |
3/3,0,0,0 | 2062/A | 1999/ASR |
| SFR/D |
22621
|
Susana AVE | $850,000 | $1,049.38 | 3/1,0,0,0 | 810/A | 1952/ASR |
| SFR/D |
3921 W
|
234th PL | $866,000 | $ 513.34 |
4/2,0,0,0 | 1687/A | 1962/ASR |
| SFR/D |
4713
|
Vanderhill RD | $890,000 | $ 772.57 |
3/2,0,0,0 | 1152/A | 1956/ASR |
| SFR/D |
23148
|
Anza AVE | $900,000 | $ 585.94 |
3/2,0,0,0 | 1536/A | 1960/ASR |
| SFR/D |
23430
|
Evalyn AVE | $1,035,000 |
$ 449.02 |
5/1,2,0,0 | 2305/A | 1962/PUB |
| SFR/D |
5006
|
Sharynne LN | $1,750,000 |
$ 673.08 |
4/2,1,0,0 | 2600/E | 1949/ASR |
| CONDO/A |
5500
|
Torrance BLVD #C323 | $615,000 | $ 453.54 |
3/2,0,0,0 | 1356/A | 1990/ASR |
| CONDO/A |
21345
|
Hawthorne BLVD #101 | $665,000 | $ 540.65 |
3/2,0,0,0 | 1230/A | 2005/ASR |
| SFR/D |
5125
|
Sepulveda BLVD | $785,000 | $ 675.56 |
3/1,1,0,0 | 1162/A | 1955/OTH |
| SFR/A |
4018
|
TORRANCE | $875,000 | $ 506.95 |
3/2,0,0,0 | 1726/ | 1956 |
| SFR/D |
21713
|
Ladeene AVE | $921,000 | $ 792.60 |
3/1,1,0,0 | 1162/A | 1956/ASR |
| SFR/D |
5215
|
Scott ST | $960,000 | $ 541.46 |
3/1,1,0,0 | 1773/A | 1955/PUB |
| SFR/D |
5109
|
Beran ST | $961,000 | $ 438.61 |
4/4,0,0,0 | 2191/A | 1955/PUB |
| SFR/D |
21502
|
Linda DR | $1,000,000 |
$ 547.05 |
4/2,0,1,0 | 1828/A | 1955/ASR |
| TWNHS/A |
3727
|
Emerald ST #B | $600,000 | $ 531.91 |
2/2,0,1,0 | 1128/A | 1987/ASR |
| SFR/D |
5105
|
Arvada ST | $730,000 | $ 421.48 |
3/2,0,0,0 | 1732/A | 1954/ASR |
| COMRES/A |
3642
|
Garnet ST | $800,000 | $ 148.45 |
11/7,0,0,0 | 5389/A | 1973/PUB |
| TWNHS/A |
4489
|
Spencer ST #302 | $830,000 | $ 405.27 |
3/2,0,1,0 | 2048/A | 1995/ASR |
| SFR/D |
4765 W
|
191st ST | $855,000 | $ 439.14 |
4/2,0,0,0 | 1947/A | 1954/ASR |
| TWNHS/D |
20508
|
EARL ST | $875,000 | $ 446.20 |
3/2,0,2,0 | 1961/ | 2004 |
| SFR/D |
19905
|
Mansel AVE | $909,500 | $ 649.18 |
3/1,1,0,0 | 1401/A | 1955/ASR |
| SFR/D |
20015
|
Saltee AVE | $940,000 | $ 654.14 |
3/2,0,0,0 | 1437/A | 1955/ASR |
| SFR/D |
20019
|
Mildred AVE | $1,300,000 |
$ 591.72 |
4/1,1,1,0 | 2197/A | 1970/ASR |
| SFR/D |
5515
|
Arvada ST | $1,360,000 |
$ 486.06 |
4/4,0,0,0 | 2798/A | 1956/ASR |
| TWNHS/A |
3429 W
|
171st ST | $499,000 | $ 352.40 |
3/1,0,1,0 | 1416/A | 1974/ASR |
| SFR/A |
18334
|
FALDA AVE | $573,500 | $ 656.93 |
2/1,0,0,0 | 873/ | 1953/BLD |
| SFR/D |
3633 W
|
177th ST | $580,000 | $ 657.60 |
2/1,0,0,0 | 882/A | 1953/ASR |
| SFR/D |
18327
|
Elgar AVE | $610,000 | $ 690.05 |
3/1,0,0,0 | 884/A | 1953/ASR |
| SFR/D |
17008
|
Ermanita AVE | $695,000 | $ 630.10 |
3/1,1,0,0 | 1103/A | 1951/ASR |
| SFR/D |
17108
|
Glenburn AVE | $700,000 | $ 596.25 |
2/2,0,0,0 | 1174/A | 1948/ASR |
| SFR/D |
18820
|
Patronella AVE | $705,000 | $ 595.94 |
3/1,0,1,0 | 1183/A | 1953/PUB |
| SFR/D |
16623
|
Falda AVE | $711,750 | $ 564.88 |
3/2,0,0,0 | 1260/A | 1952/ASR |
| SFR/D |
3621 W
|
177th Street | $720,000 | $ 435.31 |
3/2,0,0,0 | 1654/A | 1953/ASR |
| SFR/D |
3709 W
|
180th PL | $750,000 | $ 496.03 |
4/2,0,0,0 | 1512/A | 1953/ASR |
| SFR/D |
16705
|
Francis CT | $769,000 | $ 372.76 |
4/3,0,0,0 | 2063/A | 1963/ASR |
| SFR/D |
3633 W
|
181st ST | $795,000 | $ 485.35 |
3/2,0,0,0 | 1638/A | 1953/ASR |
| TWNHS/D |
18512
|
Roslin AVE | $799,000 | $ 392.44 |
3/4,0,0,0 | 2036/B | 2018/BLD |
| SFR/D |
16815
|
Fonthill AVE | $815,000 | $ 372.32 |
4/2,0,0,0 | 2189/ | 1954 |
| SFR/D |
3733
|
Sandgate DR | $815,000 | $ 449.53 |
4/3,0,0,0 | 1813/D | 1960/ASR |
| SFR/D |
18932
|
Florwood AVE | $833,000 | $ 374.89 |
5/2,0,1,0 | 2222/A | 1953/ASR |
| SFR/D |
18328
|
Roslin AVE | $894,000 | $ 517.96 |
4/3,0,0,0 | 1726/B | 1949/ASR |
| SFR/D |
4345 W
|
190th ST | $985,000 | $ 321.90 |
4/4,0,0,0 | 3060/A | 2006/ASR |
| TWNHS/A |
2052
|
Artesia | $520,000 | $ 448.28 |
2/2,0,1,0 | 1160/A | 2001/ASR |
| SFR/A |
2603 W
|
166th PL | $605,000 | $ 395.68 |
4/1,1,0,0 | 1529/A | 1955/ASR |
| SFR/D |
2502 W
|
170th ST | $625,000 | $ 520.83 |
3/2,0,0,0 | 1200/A | 1955/ASR |
| SFR/D |
2618 W
|
180th ST | $645,000 | $ 338.23 |
4/3,0,0,0 | 1907/A | 1956/ASR |
| SFR/D |
18902
|
Haas AVE | $680,000 | $ 406.94 |
3/2,0,0,0 | 1671/A | 1951/ASR |
| SFR/D |
16403
|
Wilkie AVE | $689,000 | $ 662.50 |
3/1,1,0,0 | 1040/A | 1951/ASR |
| SFR/D |
2418 W
|
180th PL | $710,000 | $ 584.36 |
3/1,1,0,0 | 1215/A | 1956/ASR |
| TWNHS/A |
17510
|
Van Ness Avenue #5 | $795,000 | $ 461.14 |
3/2,0,2,0 | 1724/B | 2018/BLD |
| TWNHS/A |
17508
|
Van Ness Avenue #4 | $800,000 | $ 464.04 |
3/2,0,2,0 | 1724/B | 2018/BLD |
|
2454
|
Del Amo BL | $ 805.00 |
1/1,0 | 650/A | 1948 | ||
| TWNHS/A |
2160
|
Plaza Del Amo #178 | $560,000 | $ 368.42 |
3/2,0,1,0 | 1520/A | 1979/PUB |
| TWNHS/A |
2714
|
Cabrillo AVE | $677,500 | $ 410.61 |
2/2,0,0,1 | 1650/A | 2006/ASR |
| TWNHS/A |
813
|
Van Ness AVE #B | $689,000 | $ 490.04 |
3/3,0,0,0 | 1406/A | 2000/ASR |
| TWNHS/A |
2444
|
Cabrillo AVE | $695,000 | $ 566.42 |
2/2,0,1,0 | 1227/D | 2018/BLD |
| SFR/D |
1308
|
Cota AVE | $700,000 | $ 628.93 |
2/1,1,0,0 | 1113/A | 1926/ASR |
| TWNHS/A |
1800
|
Oak St. #519 | $705,000 | $ 473.15 |
2/2,0,1,0 | 1490/A | 2007/ASR |
| TWNHS/A |
1800
|
Oak ST #103 | $760,000 | $ 383.84 |
2/2,0,1,0 | 1980/A | 2007/ASR |
| SFR/D |
23305
|
Huber AVE | $740,000 | $ 439.43 |
3/2,0,0,0 | 1684/A | 1948/PUB |
| SFR/D |
1846
|
Reynosa DR | $765,000 | $ 467.03 |
4/2,0,0,0 | 1638/A | 1948/ASR |
| SFR/D |
2218 W
|
229th PL | $795,000 | $ 388.18 |
3/3,0,0,0 | 2048/A | 1962/ASR |
| SFR/D |
2155 W
|
235th PL | $927,900 | $ 388.89 |
4/3,0,0,0 | 2386/A | 1974/ASR |