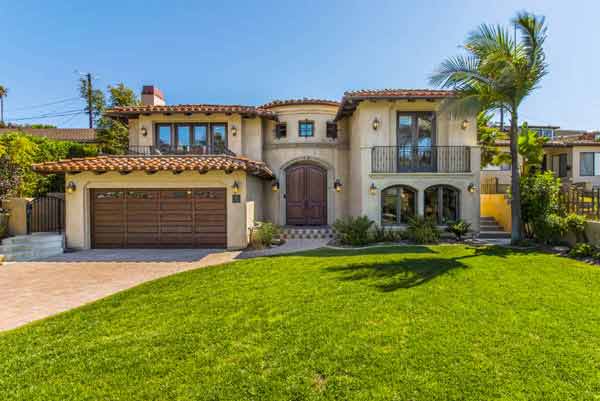
The big sale of the month in Torrance was a very large single family home in South Torrance in the Seaside (Christmas Lights)
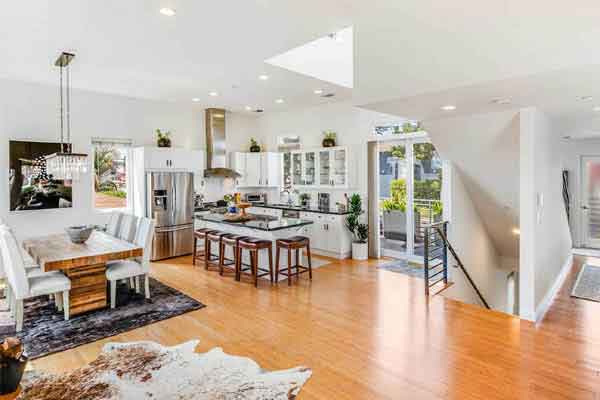
neighborhood. The home was built in 1998 and offered almost 3,000 square feet with 4 bedrooms and 3 baths. The lot was over 8,000 square feet although much was on a hillside. The home was listed at $1,848,000 and sold for an impressive $2,130,000 after only a few days on the market.
Contact us for more information on this home
Search the current homes for sale in the Seaside Ranchos and South Torrance neighborhoods

5109 Bindewald Torrance 90505- Sold At $2,130,000
Listing courtesy of Jenna Christensen & Rebecca Davidson – Engel & Volkers LA-South Bay – 310-543-9999