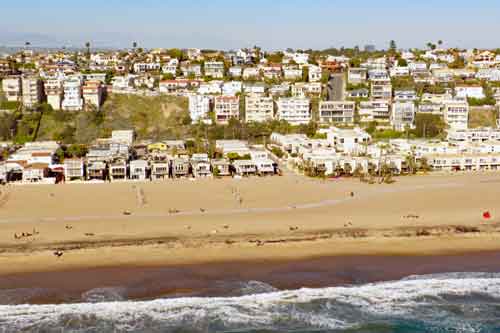
Torrance is the biggest city in the South Bay……but it’s certainly not the only city. The South Bay offers an abundance of housing options, diferent community experiences and even varying climates!
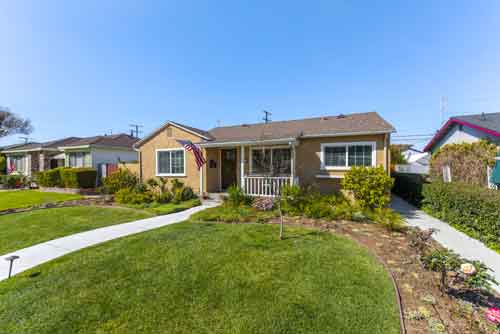
If Torrance CA isn’t the only neighborhood you might be interested in, click on any city, neighborhood or photo below to see a real estate website designed specifically to provide valuable information on that area. See the current homes for sale, recent home sales, market statistics, area maps, photos and more. We hope that our information can help you with your home search. If you want other information or would like our assistance with your search please don’t hesitate to contact Keith Kyle for all of your real estate needs.
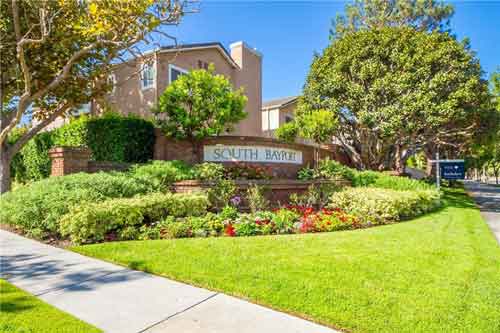
South Bay Communities and Real Estate Websites
We hope you’ll have everything you need to learn about these cities, communities and neighborhoods in the area.
 |
 |
 |
 |
 |
 |
 |
 |
 |
 |
 |
 |
 |
 |
 |
 |
 |
 |
 |
 |
 |
 |
 |
 |
 |
 |
 |
 |
 |
|


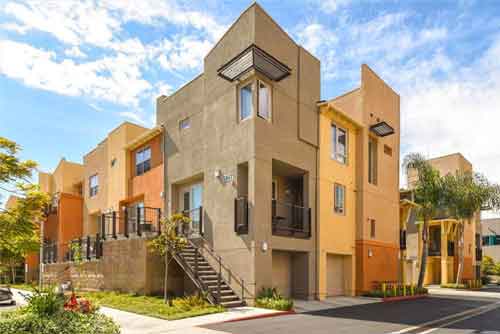
 the average sales price at $744,270. The median list price was $729,000 while the median sold price was at $715,875. The highest sale of the month was $1,750,000 for a 4 bedroom