• Home
  • FREE Email Listing Updates
  • Search for Homes
    • Search The MLS
    • Search By Map
    • Search by Zip Code
    • 55+ Senior Communities
    • Open Houses in Torrance
    • South Bay homes & real estate
  • Search by Neighborhood
    • All Torrance Listings
    • Old Torrance – 90501
    • West Torrance – 90503
    • South Torrance – 90505
    • Southwood – 90503
    • Central Torrance – 90503
    • Southeast Torrance – 90501 & 90505
    • North Torrance – 90504
    • Walteria and Victoria Knolls – 90505
    • Hollywood Riviera – 90277
    • Plaza Del Amo
    • Harbor Strip & Gateway – 90501
  • Search by Price
    • Below $450,000
    • $450,000 – $600,000
    • $600,000 – $750,000
    • $750,000-$900,000
    • $900,000-$1,100,000
    • $1,100,000-$1,250,000
    • $1,250,000-$1,500,000
    • Above $1,500,000
  • Sellers
    • What is my Home Worth?
    • How We Sell
    • Quick Home Valuation
    • Recent Torrance Property Prices
    • Quick Valuation
  • Market News
  • About
    • Neighborhoods
      • Torrance Schools
      • Neighborhood Map
      • West Torrance
      • Southwood
      • Hollywood Riviera
      • Walteria & Victoria Knolls
      • South Torrance
      • Old Torrance
      • North Torrance
      • Plaza Del Amo
      • Central Torrance
      • 55+ Senior Communities
      • South Bay and Palos Verdes
    • Your Torrance Realtor
      • Client Testimonials
      • Vista Sotheby’s
      • Contact Us – Torrance Realtor Keith Kyle of Vista Sotheby’s
      • Search for Homes by Torrance Neighborhood or Community Map
      • The Cities in the South Bay
      • Our Google+ Profile
      • Home Selling Process
    • Torrance Schools
    • Recent home sales and escrows
    • Market Trends
      • Hollywood Riviera
      • West Torrance
      • Walteria
      • Old Torrance
      • North Torrance West

Torrance real estate and homes for sale

Search for homes in Torrance CA

October 2017 Torrance and South Bay Home Sales

December 17, 2017 by Keith Kyle

October 2017 was a big month for home sales in Torrance with 127 closed sales.  Median home prices through all of Torrance CA was $675,000 which was slightly under 7% gain over October 2016.  The Torrance market has been extremely busy with prices continuing to rise.  The rest of the South Bay saw a mix of year over year increases and decreases.  See the Torrance homes that sold in October

City Homes Sold October 2017 Median October 2016 Median Year over Year % Change%
Carson 58 $495,000 $455,000 8.8%
El Segundo 19 $875,000 $925,000 -5.4%
Gardena 43 $545,000 $490,000 11.2%
Harbor City 17 $510,000 $4145,000 23%
Hawthorne 50 $578,000 $540,000 6.9%
Hermosa Beach 21 $1,414,000 $2,038,000 -30.6%
Lawndale 21 $505,000 $411,000 23%
Lomita 17 $575,000 $580,000 -.9%
Long Beach 322 $525,000 $475,000 10.5%
Manhattan Beach 28 $2,875,000 $2,250,000 27.8%
Marina Del Rey 25 $979,000 $1,150,000 14.9%
Palos Verdes Estates 30 $1,600,000 $1,825,000 -12.3%
Play Del Rey 16 $665,000 $635,000 4.8%
Rancho Palos Verdes 47 $1,265,000 $1,250,000 1.2%
Redondo Beach 72 $1,105,000 $878,000 25.8%
San Pedro 69 $530,000 $588,000 -9.8%
Torrance 127 $675,000 $632,000 6.9%
Westchester 38 $1,089,000 $1,050,000 3.7%

Filed Under: Home Prices, Homes for Sale, Torrance CA real estate market

Torrance Real Estate Statistics

November 21, 2017 by Keith Kyle

Information is critical in real estate and the right information can help you determine where the market has been and where the market is heading.  See the various charts below to view some important real estate statistics such as average sales price in Torrance, number of active v pending listings, etc.

Median Home Prices in Torrance

Number of active Listings

Number of Pending Home Sales

Number of Closed Sales

Median Price Per Foot

Filed Under: Buyers, Home Prices, Homes for Sale, Torrance CA real estate market Tagged With: median price per foot, number of closed sales, number of homes for sale, number of pending listings, Torrance real estate statistics including average sales price

Torrance Real Estate – By the Numbers

November 15, 2017 by Keith Kyle

Information is key to making sound real estate decisions. The information below should help you keep up with the market and provide valuable insight into where the market currently is and where it’s going in the future.  See below for updated information such as number of active homes, pending sale, recent closed home sales and home prices for Torrance, Manhattan Beach, Hermosa Beach and Redondo Beach

New Listings

Active Listings

Pending Sales

Closed Sales

Days on Market

Price Per Foot

Average Sales Price

Filed Under: Home Prices, Homes for Sale, Torrance Real Estate, Torrance real estate trends

August 2017 Home Sales and Home Prices for Torrance CA

October 11, 2017 by Keith Kyle

Torrance saw a nice jump in home sales with a 154 recorded property sales for August of 2017.  Overall the South Bay trended up from the previous year in terms of median home prices with only a few local cities seeing a decrease in y over year prices.
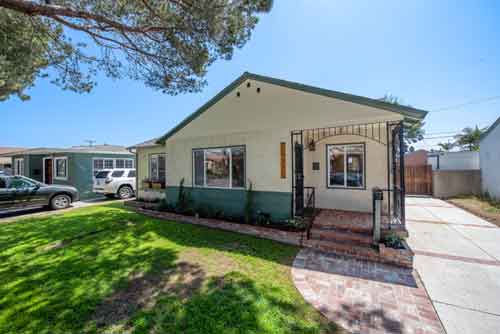
Torrance saw a median home price of just under $700,000 and the numbers continue to trend upward.  To see all of the home sales in Torrance and the cities below visit our recent home sales page.

City Homes
Sold
August
2017 Median
August
2016 Median
Year
over Year % Change%
Carson 52 $470,000 $450,000 4.3%
El Segundo 15 $1,235,000 $1,075,000 14.9%
Gardena 53 $495,000 $472,000 4.9%
Harbor City 20 $521,000 $522,000 -.2%
Hawthorne 45 $583,000 $575,000 1.4%
Hermosa Beach 22 $1,358,000 $1,723,000 21.2%
Lawndale 17 $460,000 $498,000 -7.5%
Lomita 19 $610,000 $619,000 -1.5%
Long Beach 404 $490,000 $463,000 5.9%
Manhattan Beach 36 $2,230,000 $1,815,000 22.9%
Marina Del Rey 37 $940,000 $1,059,000 -11.2%
Palos Verdes Estates 37 $1,545,000 $1,413,000 9.4%
Playa Del Rey 27 $625,000 $623,000 .3%
Rancho Palos Verdes 60 $1,088,000 $1,065,000 2.2%
Redondo Beach 118 $975,000 $969,000 .6%
San Pedro 78 $572,000 $481,000 19%
Torrance 154 $698,000 $645,000 8.2%
Westchester 50 $1,180,000 $1,093,000 8%

Filed Under: Home Prices, Homes for Sale, Torrance CA real estate market, Torrance real estate trends Tagged With: recent sales in torrance, torrance home sales, torrance real estate

How Do I find Off Market and Pocket Listings in Torrance CA?

September 13, 2017 by Keith Kyle

In this incredibly competitive real estate environment many homes are not even making it to the market.   So how do you find out about these homes?  First it’s important to understand just what we’re talking about.

What does off market or a pocket listing mean?

It can actually mean a few different things but in general, when we refer to homes sold off market or pocket listings these are homes that are never put on the MLS and therefore unknown to most buyers and many realtors.  That means that searching the Redfins and Zillows of the world may mean that you’re not aware of these types of opportunities.

Why would a Torrance homeseller want to sell the home off market?

In general it’s not a great idea.  Fewer buyers that know about the home usually means less competition and ultimately a lower sales price.  That’s certainly not always the case but usually accurate to some extent.  Sellers have many reasons for not wanting to put their home on the market.  It may be due to privacy reasons such as not wanting the neighbor or even the tenant know that the home is for sale.  It may be that they don’t want to deal with some of the hassles that come along with listing a home…..buyer’s and agents that want to show the home at all hours, open houses on the weekends and more people simply curious with few legitimate buyers.  Whatever the reason it does limit the exposure and again usually limits the price.

That’s why it can be a good opportunity for buyers….less competition, fewer bidding wars which generally leads to a lower sales price.

How do I find out about these homes?El Camino Village homes

Unlike the MLS listings, off market, upcoming and pocket listings are much more elusive.  The key is to work with an agent that has deep connections in the Torrance real estate market and community.  Some of the top realtors in certain areas may share information on these hard to find opportunities and the larger or more numerous the seller and agent networks, the more information the agent can obtain.

We are happy to help you find off market homes in Torrance but this requires a good deal of work, considerable communication with sellers and agents and a readiness to act should the right home come available.  If you would like us to help find off market opportunities and are not currently working with a realtor please feel free to text us at 310-251-2344 or email us with the details of your home search.

Filed Under: Buyers, Homes for Sale, Pocket Listings, Sellers, Torrance CA real estate market, Torrance Real Estate Tagged With: off market homes in torrance, pocket listings in torrance

Torrance Median Home Prices Up in July

September 6, 2017 by Keith Kyle

What a month it was for home sales in Torrance and the South Bay.  Double digit year over year changes were the norm but there was really no sense to it with some cities seeing major increases over June of 2016 and some seeing just as major drops in home prices.

Real estate in Torrance CA was no different with another double digit jump for the median home prices compared with July of 2016. Torrance was actually a bit more moderate than other areas but still saw 113 homes close escrow in July with a median home price of just under $687,000  Click here to see the recent home sales in Torrance and the South Bay.

City Homes Sold July 2017 Median July 2016 Median Year over Year % Change%
Carson 60 $480,000 $445,000 8%
El Segundo 20 $1,055,000 $1,310,000 -19.5%
Gardena 65 $549,000 $454,000 21%
Harbor City 15 $439,000 $550,000 -20.2%
Hawthorne 35 $730,000 $562,000 30%
Hermosa Beach 19 $2,025,000 $1,410,000 43.6%
Lawndale 15 $515,000 $430,000 19.8%
Lomita 21 $598,000 $585,000 2.1%
Long Beach 331 $520,000 $471,500 10.3%
Manhattan Beach 48 $2,449,000 $2,200,000 11.3%
Marina Del Rey 36 $921,000 $974,000 -5.4%
Palos Verdes Estates 28 $1558,000 $1,800,000 -13.4%
Playa Del Rey 20 $613,000 $629,000 -2.5%
Rancho Palos Verdes 63 $1,345,000 $1,160,000 15.9%
Redondo Beach 95 $975,000 $920,000 6%
San Pedro 63 $542,000 $542,000 0%
Torrance 113 $687,000 $617,000 11.4%
Westchester 33 $1,185,000 $1,116,000 6.2%

Filed Under: Home Prices, Homes for Sale, Torrance Real Estate, Torrance real estate trends Tagged With: recent sales in torrance, torrance home prices, torrance home sales, torrance real estate

  • « Previous Page
  • 1
  • …
  • 22
  • 23
  • 24
  • 25
  • 26
  • …
  • 34
  • Next Page »
  • FREE Listing Updates
  • What’s Your Home Worth?
  • Search Torrance CA Homes For Sale and Current Listings