Take a look at the charts below to get a better understanding of what’s happening in the Torrance real estate market. We hope that getting an awareness of what the real estate market has been doing for the past 18 months can help make you a knowledgeable home buyer or seller in this great city. See the current homes for sale in the various neighborhoods of Torrance.
For Sale, Sold and Pending Sales in Torrance CA
The chart below shows the average price per square foot. Square footage in the South Bay often doesn’t mean as much as in other markets as values can vary so dramatically due to things such as proximity to the beach, views, specific neighborhoods.
The chart below shows the average days on market per month as well as the % of list price that homes sold at. A high % indicates a sellers market as home sell at, or above list price.
The chart below shows the average price for listed home sales in relation to the average price for sold homes.
The chart below indicates the months of home inventory based on closed home sales. Buyer’s market: more than 6 months of inventory Seller’s market: less than 3 months of inventory Neutral market: 3 – 6 months of inventory
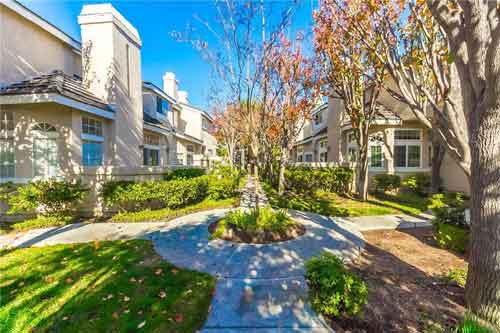 inTorrance that are similar there is no concentration of these single family, townhome and condo communities anywhere else. It’s really a real estate market unto itself in the heart of Torrance.