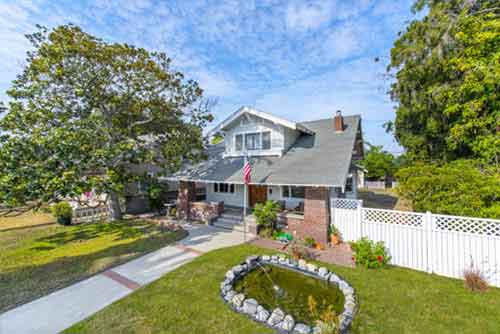
September 2022 was another good month for both the number of homes that sold as well as the prices that they sold for in the neighborhood of old town Torrance. There were 9 sold homes during the month.
The average list price for the homes that sold during September was $824,333 with the average sold price at $804,000.
The average price per foot for the month was $597. Homes averaged 37 days on the market before going into pending status. See how that compares with other months on our Old Torrance real estate trends and statistics page.
- Search the current homes for sale in only Old Torrance
- Search the current homes for sale in all of Torrance
Home Sales and Prices in Old Torrance
| Type | Address | Price | $ Per foot | Bed/Bath | Sq Feet | Year | |
| CONDO/A | 1301 | Cabrillo AVE #117 | $466,000 | $769 | 1/1,0,0,0 | 606/A | 1993/ASR |
| CONDO | 1262 | Engracia AVE | $650,000 | $740 | 2/1,0,1,0 | 878/ | 2005 |
| CONDO/A | 2367 | Jefferson ST #311 | $775,000 | $615 | 2/2,0,0,0 | 1261/A | 2007/ASR |
| TWNHS/A | 2136 | Washington AVE | $786,000 | $570 | 2/3,0,0,0 | 1379/A | 2006/ASR |
| TWNHS/A | 2102 | Washington AVE | $795,000 | $577 | 2/2,0,1,0 | 1379/A | 2006/PUB |
| SFR/D | 1719 | Gramercy AVE | $865,000 | $402 | 4/2,1,0,0 | 2150/AP | 1912/ASR |
| TWNHS/A | 1630 | Gramercy AVE #4 | $869,000 | $530 | 3/1,1,1,0 | 1640/A | 2010/ASR |
| TWNHS/D | 2602 | Cabrillo AVE | $930,000 | $476 | 4/2,0,1,0 | 1952/A | 1990/ASR |
| DPLX/D | 1819 | Andreo AVE | $1,100,000 | $701 | 3/2,1,0,0 | 1570/A | 1924/ASR |